
Note
Go to the end to download the full example code or to run this example in your browser via JupyterLite.
Buckling and effective length#
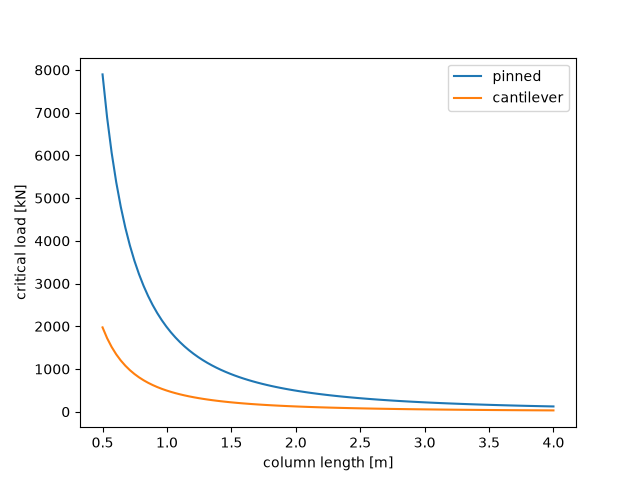
For an ideal elastic column the critical load scales as inverse length squared. The pinned and cantilever curves differ through the effective length factor.
import matplotlib.pyplot as plt
import numpy as np

from engineeringkit.structural_engineering import euler_buckling_load

length = np.linspace(0.5, 4, 100)
fig, ax = plt.subplots()
for K, label in [(1, "pinned"), (2, "cantilever")]:
    loads = [euler_buckling_load(200e9, 1e-6, L, K) for L in length]
    ax.plot(length, np.array(loads) / 1000, label=label)
p1 = euler_buckling_load(200e9, 1e-6, 1)
p2 = euler_buckling_load(200e9, 1e-6, 2)
assert np.isclose(p1 / p2, 4)
ax.set(xlabel="column length [m]", ylabel="critical load [kN]")
ax.legend()

plt.show()
Total running time of the script: (0 minutes 0.103 seconds)
