Examples#
This gallery walks through every public feature of mathematicskit.statistics:
descriptive statistics, hypothesis tests, confidence intervals,
ordinary least-squares regression, correlation, maximum likelihood,
nonparametric tests, bootstrap and jackknife resampling, shrinkage
estimation, and multiple-testing corrections.
See also the narrative tutorial:
Each script in this gallery is self-contained and can be run directly with
python examples/statistics/<section>/<script>.py.
Sections#
descriptive – the five-number summary, skewness, and kurtosis, and Gauss’s normal law of measurement errors.
hypothesis_tests – z-tests, t-tests, chi-square tests, ANOVA, and Fisher’s exact test.
confidence_intervals – intervals for means, proportions, and variances.
regression – ordinary least squares with residual diagnostics.
correlation – Pearson’s and Spearman’s correlation coefficients.
likelihood – maximum-likelihood fitting and Wilks’s likelihood-ratio test.
nonparametric – the Kolmogorov-Smirnov, Wilcoxon signed-rank, and Mann-Whitney U tests.
bootstrap – bootstrap confidence intervals via
scipy.stats.bootstrap, and the jackknife.shrinkage – the James-Stein estimator.
multiple_testing – Bonferroni and Benjamini-Hochberg corrections.
pca – Pearson’s lines of closest fit and Hotelling’s principal components.
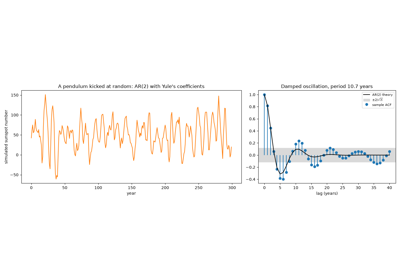
time_series – autocorrelation and Yule’s autoregressive models.
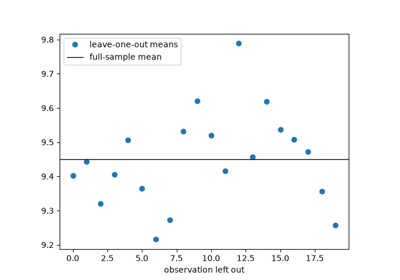
Bootstrap resampling#
Bootstrap confidence intervals via scipy.stats.bootstrap, and the
leave-one-out jackknife.

Confidence intervals#
Intervals for means, proportions, and variances.
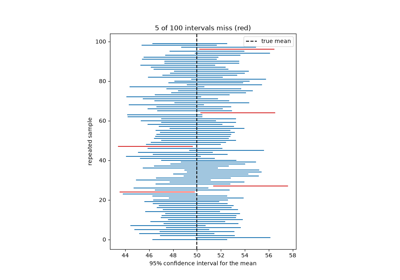
Confirming a 95% confidence interval’s coverage by simulation
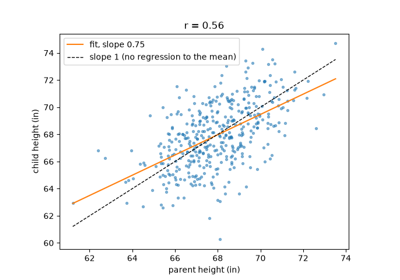
Correlation#
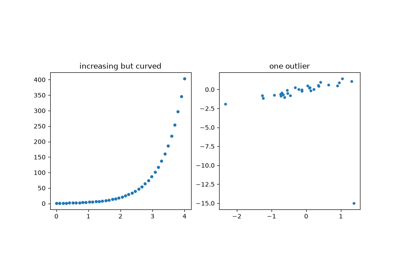
Pearson’s product-moment and Spearman’s rank correlation coefficients.
Descriptive statistics#
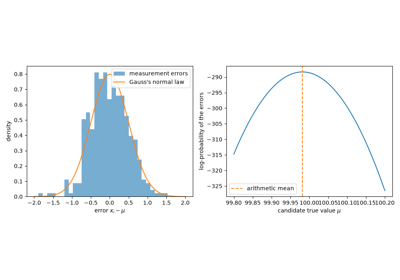
The five-number summary, skewness, and kurtosis, and Gauss’s normal law of measurement errors.
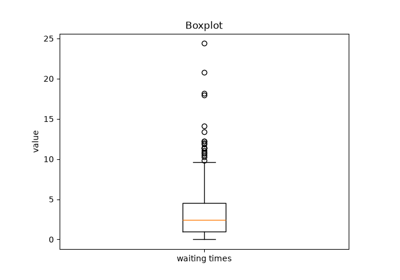
Descriptive statistics and the five-number summary
Hypothesis tests#
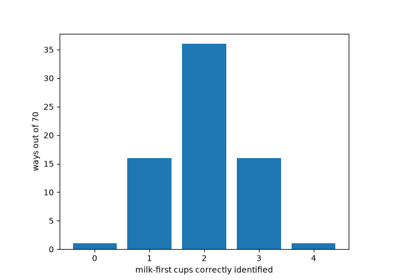
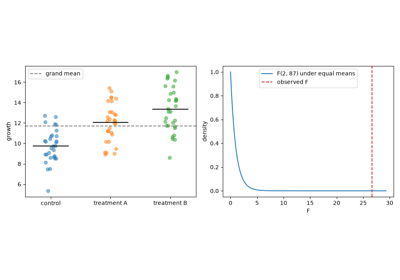
z-tests, Student’s t-tests, chi-square tests (goodness-of-fit and independence), Fisher’s exact test, and one-way ANOVA.
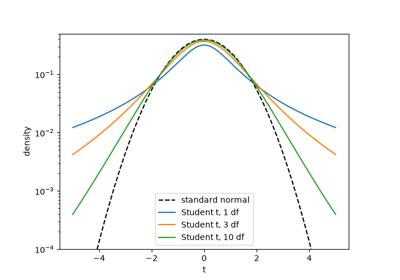
Student’s t-distribution and the small-sample t-test

Likelihood#
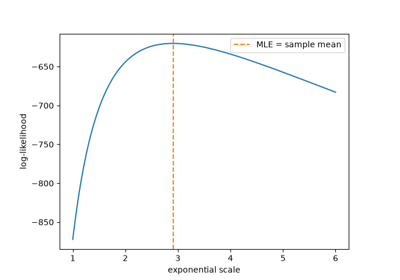
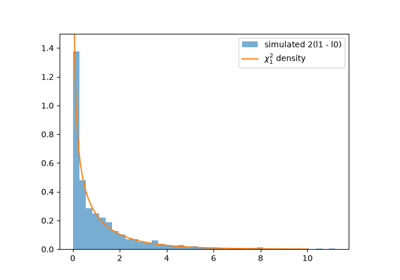
Maximum-likelihood fitting and the likelihood-ratio test.
Multiple testing#
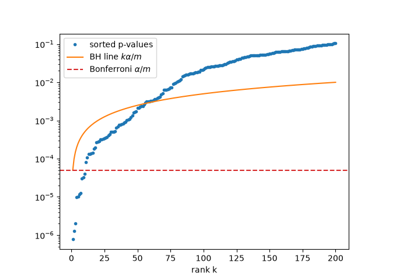
Bonferroni and Benjamini-Hochberg corrections for many simultaneous tests.
Nonparametric tests#
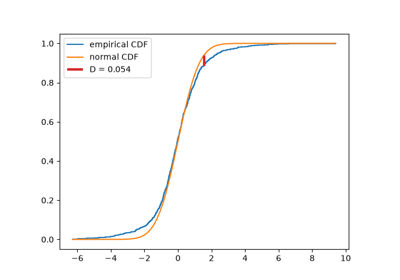
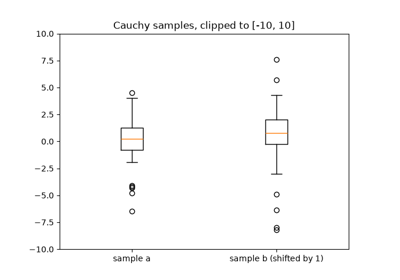
The Kolmogorov-Smirnov test and the Wilcoxon and Mann-Whitney rank tests.
Principal component analysis#
Pearson’s lines of closest fit and Hotelling’s principal components.
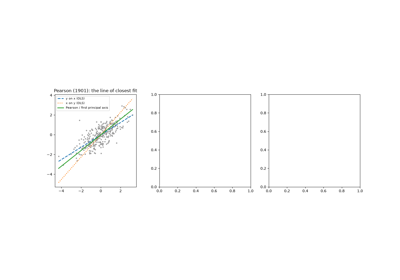
Pearson and Hotelling’s principal component analysis
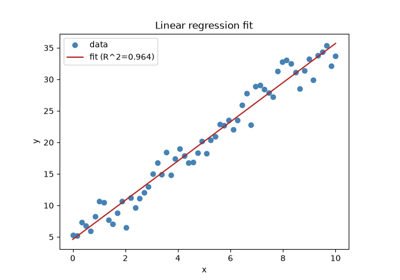
Linear regression#
Ordinary least squares with residual diagnostics.
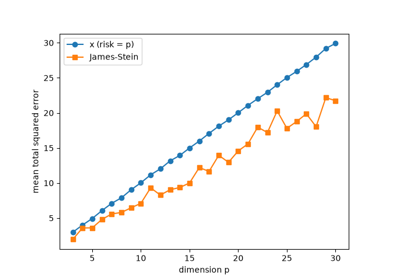
Shrinkage estimation#
The James-Stein estimator and Stein’s paradox.
Time series#
Sample autocorrelation and autoregressive models fitted by the Yule-Walker equations.