
Note
Go to the end to download the full example code or to run this example in your browser via JupyterLite.
Reynolds’ dimensionless number and wind-tunnel similarity#
Osborne Reynolds’ dye experiments (1883) showed that pipe flow turns
turbulent when \(\rho V D/\mu\) exceeds a critical value, whatever the
individual fluid, speed or diameter. The same number
(reynolds_number()) decides whether a
scale model reproduces full-scale flow: matching it at reduced size forces
higher speed or denser gas, which is why NACA built a pressurised
variable-density tunnel in 1923.
import matplotlib.pyplot as plt
import numpy as np

from engineeringkit.aerodynamics import isa_atmosphere, reynolds_number

mu_air = 1.789e-5
From insects to airliners#
cases = {
    "fruit fly": (1.225, 1.0, 0.002),
    "sparrow": (1.225, 10.0, 0.05),
    "glider": (1.225, 30.0, 1.0),
    "light aircraft": (1.225, 60.0, 1.5),
    "airliner cruise": (float(isa_atmosphere(11000.0).density), 240.0, 6.0),
}
names, values = [], []
for name, (rho, V, chord) in cases.items():
    Re = float(reynolds_number(rho, V, chord, mu_air))
    names.append(name)
    values.append(Re)
    print(f"{name:16s} Re = {Re:9.2e}")
fruit fly        Re =  1.37e+02
sparrow          Re =  3.42e+04
glider           Re =  2.05e+06
light aircraft   Re =  6.16e+06
airliner cruise  Re =  2.93e+07
Matching Reynolds number in a 1/10-scale model#
At sea-level density the model must fly ten times faster than the aircraft, which puts it in the compressible regime; raising the tunnel pressure (and so the density) is the way out.
full = float(reynolds_number(1.225, 60.0, 1.5, mu_air))
pressure_ratio = np.linspace(1, 25, 100)
model_speed = full * mu_air / (1.225 * pressure_ratio * 0.15)
speed_20atm = full * mu_air / (1.225 * 20 * 0.15)
print(f"required model speed at 1 atm: {model_speed[0]:.0f} m/s; at 20 atm: {speed_20atm:.0f} m/s")
assert np.isclose(reynolds_number(1.225 * 20, speed_20atm, 0.15, mu_air), full)

fig, axes = plt.subplots(1, 2, figsize=(10, 3.6))
axes[0].barh(names, values)
axes[0].set_xscale("log")
axes[0].set(xlabel="chord Reynolds number", title="Reynolds numbers in flight")
axes[1].plot(pressure_ratio, model_speed)
axes[1].axhline(0.3 * 340, color="gray", ls="--", label="Mach 0.3")
axes[1].set(xlabel="tunnel pressure [atm]", ylabel="model speed [m/s]", title="1/10 model, matched Re")
axes[1].legend()
fig.tight_layout()

plt.show()
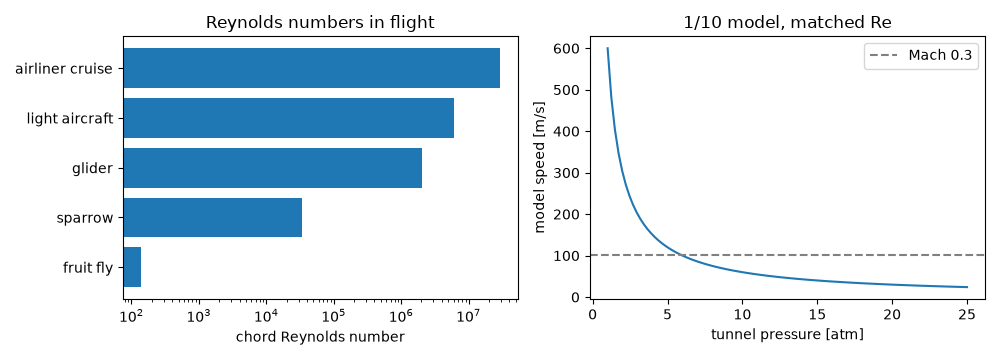
required model speed at 1 atm: 600 m/s; at 20 atm: 30 m/s
Total running time of the script: (0 minutes 0.292 seconds)
