
Note
Go to the end to download the full example code or to run this example in your browser via JupyterLite.
The Breguet range equation#
Louis Breguet’s range formula (1923) follows from three facts: thrust equals
drag, drag equals weight divided by \(L/D\), and fuel flow is the
thrust-specific fuel consumption times thrust. Integrating the weight loss
gives \(R = \frac{V}{g c_T}\frac{L}{D}\ln\frac{W_i}{W_f}\)
(breguet_range()): range is the product of
engine efficiency, aerodynamic efficiency and a logarithmic fuel fraction.
This example checks it against a time-stepped cruise and shows why airliners
fly near the best-glide lift coefficient.
import matplotlib.pyplot as plt
import numpy as np

from engineeringkit.aerodynamics import best_glide_cl, breguet_range, drag_polar, glide_ratio

g = 9.80665
V, tsfc = 230.0, 1.6e-5
W0, Wf = 7.0e5, 5.0e5
LD = 18.0
Step the cruise in time#
W, x, dt = W0, 0.0, 10.0
while W > Wf:
    fuel_flow = tsfc * W / LD
    W -= fuel_flow * g * dt
    x += V * dt
print(f"time-stepped range: {x / 1e3:7.0f} km")
print(f"Breguet range:      {float(breguet_range(V, tsfc, LD, W0, Wf)) / 1e3:7.0f} km")
assert np.isclose(x, breguet_range(V, tsfc, LD, W0, Wf), rtol=1e-3)
time-stepped range:    8878 km
Breguet range:         8878 km
Range is proportional to L/D#
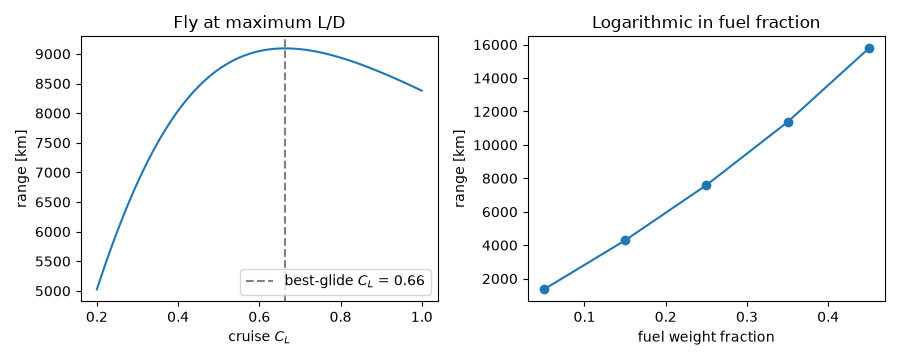
Flying at a lift coefficient away from the best-glide value lowers \(L/D\) and therefore range in direct proportion.
cd0, AR, e = 0.018, 9.5, 0.82
cl = np.linspace(0.2, 1.0, 100)
ld = glide_ratio(cl, drag_polar(cl, cd0, AR, e))
cl_star = float(best_glide_cl(cd0, AR, e))
fuel_fraction = np.linspace(0.05, 0.45, 5)
fig, axes = plt.subplots(1, 2, figsize=(9, 3.6))
axes[0].plot(cl, breguet_range(V, tsfc, ld, W0, Wf) / 1e3)
axes[0].axvline(cl_star, color="gray", ls="--", label=f"best-glide $C_L$ = {cl_star:.2f}")
axes[0].set(xlabel="cruise $C_L$", ylabel="range [km]", title="Fly at maximum L/D")
axes[0].legend()
axes[1].plot(fuel_fraction, breguet_range(V, tsfc, LD, W0, W0 * (1 - fuel_fraction)) / 1e3, "o-")
axes[1].set(xlabel="fuel weight fraction", ylabel="range [km]", title="Logarithmic in fuel fraction")
fig.tight_layout()

plt.show()
Total running time of the script: (0 minutes 0.203 seconds)
