
Note
Go to the end to download the full example code or to run this example in your browser via JupyterLite.
Quadrature modulation: QPSK doubles the rate at the same error rate#
Charles Cahn’s 1960 analysis of combined phase and amplitude modulation
formalised what quadrature carriers make possible. Cosine and sine carriers
at the same frequency are orthogonal, so each can carry an independent BPSK
stream. Gray-labelled QPSK (qpsk()) sends
two bits per symbol in the bandwidth of one. Its bit-error rate per unit
\(E_b/N_0\) equals that of BPSK
(ber_qpsk_awgn()).
import matplotlib.pyplot as plt
import numpy as np

from engineeringkit.communications import ber_qpsk_awgn, qpsk
from engineeringkit.communications.visualizers import plot_constellation
A noisy QPSK constellation#
rng = np.random.default_rng(1960)
ebn0 = 10 ** (6 / 10)
bits = rng.integers(0, 2, 400_000)
symbols = qpsk(bits)
es_n0 = 2 * ebn0
noise = (rng.normal(size=symbols.size) + 1j * rng.normal(size=symbols.size)) * np.sqrt(1 / (2 * es_n0))
received = symbols + noise
decided = np.column_stack((received.real > 0, received.imag > 0)).astype(int).reshape(-1)
ber = np.mean(decided != bits)
print(f"Eb/N0 = 6 dB: simulated QPSK BER {ber:.2e}, theory {float(ber_qpsk_awgn(ebn0)):.2e}")
assert np.isclose(ber, ber_qpsk_awgn(ebn0), rtol=0.1)

fig, axes = plt.subplots(1, 2, figsize=(9, 4))
plot_constellation(received[:3000], ax=axes[0], label="received")
plot_constellation(qpsk([0, 0, 0, 1, 1, 0, 1, 1]), ax=axes[0], label="ideal")
axes[0].set_title("QPSK at Eb/N0 = 6 dB")
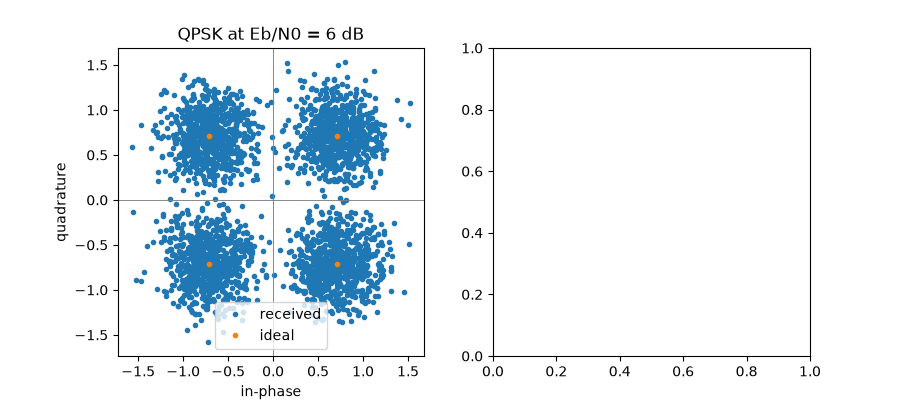
Eb/N0 = 6 dB: simulated QPSK BER 2.41e-03, theory 2.39e-03

Text(0.5, 1.0, 'QPSK at Eb/N0 = 6 dB')
Two bits per symbol in one bandwidth#
t = np.linspace(0, 4, 800, endpoint=False)
i_rail, q_rail = np.repeat(symbols[:4].real, 200), np.repeat(symbols[:4].imag, 200)
passband = i_rail * np.cos(2 * np.pi * 3 * t) - q_rail * np.sin(2 * np.pi * 3 * t)
recovered_i = 2 * np.mean((passband * np.cos(2 * np.pi * 3 * t)).reshape(4, -1), axis=1)
assert np.allclose(recovered_i, symbols[:4].real)
axes[1].plot(t, passband)
axes[1].set(xlabel="time [symbols]", title="Quadrature carriers share one band")
fig.tight_layout()

plt.show()
Total running time of the script: (0 minutes 0.192 seconds)
