
Note
Go to the end to download the full example code or to run this example in your browser via JupyterLite.
Cahn’s M-ary phase-shift keying (1959)#
Charles Cahn asked what happens when a carrier’s phase takes not two but
\(M\) values, so that each symbol carries \(\log_2 M\) bits. The
points sit on a circle (psk_constellation())
and crowd together as \(M\) grows: the distance between neighbours is
\(2\sin(\pi/M)\). Every doubling of \(M\) beyond four costs about
6 dB of \(E_s/N_0\). Cahn concluded that multiphase signalling trades
bandwidth for signal-to-noise ratio more efficiently than multilevel
amplitude signalling. The exact symbol-error rate of minimum-distance
detection (minimum_distance_detect())
is given by Craig’s integral (ser_mpsk_awgn()).
import matplotlib.pyplot as plt
import numpy as np

from engineeringkit.communications import from_db, minimum_distance_detect, psk_constellation, ser_mpsk_awgn
from engineeringkit.communications.visualizers import plot_constellation
Symbol errors by simulation and by Craig’s integral#
rng = np.random.default_rng(1959)
ebn0_db = np.arange(0, 21, 2.0)
fig, axes = plt.subplots(1, 2, figsize=(11, 4.2))
for M in (2, 4, 8, 16):
    points = psk_constellation(M)
    esn0 = from_db(ebn0_db) * np.log2(M)
    theory = ser_mpsk_awgn(esn0, M)
    axes[1].semilogy(ebn0_db, theory, label=f"{M}-PSK")
    n = 40_000
    labels = rng.integers(0, M, n)
    measured = []
    for g in esn0:
        noise = (rng.standard_normal(n) + 1j * rng.standard_normal(n)) * np.sqrt(1 / (2 * g))
        measured.append(np.mean(minimum_distance_detect(points[labels] + noise, points) != labels))
    measured = np.array(measured)
    axes[1].semilogy(ebn0_db[measured > 0], measured[measured > 0], "k.", ms=4)
    reliable = theory > 1e-2
    assert np.allclose(measured[reliable], theory[reliable], rtol=0.1)
    print(f"{M:2d}-PSK: SER at 10 dB Eb/N0 = {ser_mpsk_awgn(from_db(10.0) * np.log2(M), M):.2e}")
axes[1].set(xlabel="$E_b/N_0$ [dB]", ylabel="symbol-error rate", ylim=(1e-5, 1), title="M-PSK in AWGN (dots: simulation)")
axes[1].grid(True, which="both", alpha=0.3)
axes[1].legend()

points = psk_constellation(8)
noisy = points[rng.integers(0, 8, 2000)] + (rng.standard_normal(2000) + 1j * rng.standard_normal(2000)) * 0.12
plot_constellation(noisy, ax=axes[0])
for label, point in enumerate(points):
    axes[0].annotate(f"{label:03b}", (1.25 * point.real, 1.25 * point.imag), ha="center", va="center")
axes[0].set(title="8-PSK with Gray labels", xlim=(-1.5, 1.5), ylim=(-1.5, 1.5))
fig.tight_layout()
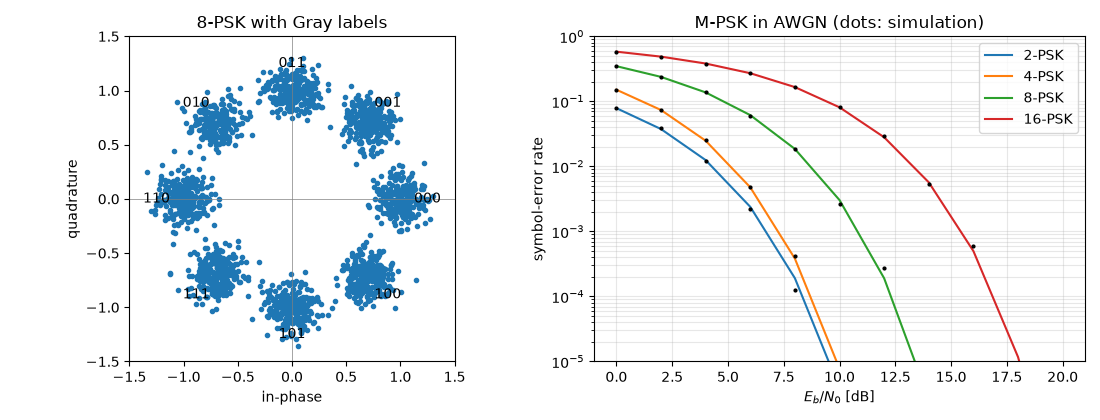
 2-PSK: SER at 10 dB Eb/N0 = 3.87e-06
 4-PSK: SER at 10 dB Eb/N0 = 7.74e-06
 8-PSK: SER at 10 dB Eb/N0 = 3.03e-03
16-PSK: SER at 10 dB Eb/N0 = 8.10e-02
Neighbouring phases differ in one bit, so a symbol error usually costs a single bit, and the bit-error rate is close to \(P_s/\log_2 M\).
distance = np.abs(points[:, None] - points[None, :])
nearest = np.isclose(distance, 2 * np.sin(np.pi / 8))
assert all(bin(i ^ j).count("1") == 1 for i, j in zip(*np.nonzero(nearest)))

plt.show()
Total running time of the script: (0 minutes 0.447 seconds)
