
Note
Go to the end to download the full example code or to run this example in your browser via JupyterLite.
OFDM: many subcarriers from one inverse DFT#
Robert Chang (1966) showed that subcarriers whose spectra overlap remain
orthogonal if they are spaced by the symbol rate. Stephen Weinstein and Paul
Ebert (1971) generated the whole set with a single inverse DFT
(ofdm_modulate()) and prefixed each block
with a copy of its tail. This cyclic prefix turns a dispersive channel’s
linear convolution into a circular one, so after the receiver’s DFT
(ofdm_demodulate()) every subcarrier sees
one complex gain, removed by a single division. The idea now carries Wi-Fi,
LTE and digital television.
import matplotlib.pyplot as plt
import numpy as np

from engineeringkit.communications import ofdm_demodulate, ofdm_modulate, qpsk
from engineeringkit.communications.visualizers import plot_constellation
A multipath channel with and without the cyclic prefix#
rng = np.random.default_rng(1971)
n_sc, n_blocks = 64, 40
symbols = qpsk(rng.integers(0, 2, 2 * n_sc * n_blocks))
channel = np.array([1.0, 0.0, 0.6 - 0.3j, 0.0, 0.0, 0.25j])
response = np.fft.fft(channel, n_sc)
fig, axes = plt.subplots(1, 3, figsize=(12, 3.8))
for ax, cp in zip(axes[:2], [0, 8], strict=True):
    tx = ofdm_modulate(symbols, n_sc, cp)
    rx = np.convolve(tx, channel)[: tx.size]
    equalised = (ofdm_demodulate(rx, n_sc, cp).reshape(-1, n_sc) / response).reshape(-1)
    error = np.sqrt(np.mean(np.abs(equalised - symbols) ** 2))
    print(f"cyclic prefix {cp}: RMS error after one-tap equalisation = {error:.2e}")
    plot_constellation(equalised, ax=ax)
    ax.set_title(f"cyclic prefix = {cp} samples")
assert error < 1e-12
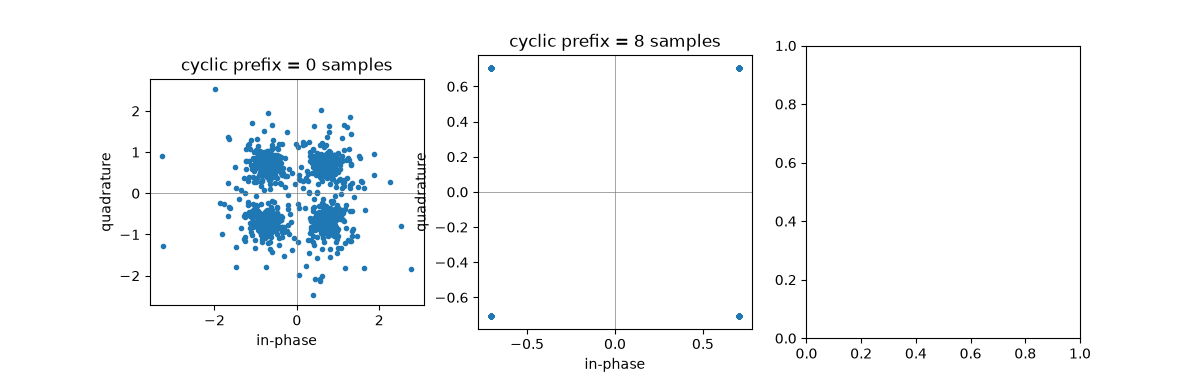
cyclic prefix 0: RMS error after one-tap equalisation = 3.26e-01
cyclic prefix 8: RMS error after one-tap equalisation = 3.78e-16
The channel seen by each subcarrier#
With the prefix, the demodulated pilot divided by the transmitted symbol is exactly the channel’s frequency response at that subcarrier.
estimate = (ofdm_demodulate(np.convolve(ofdm_modulate(symbols[:n_sc], n_sc, 8), channel)[: n_sc + 8], n_sc, 8)) / symbols[:n_sc]
assert np.allclose(estimate, response)
axes[2].plot(np.abs(response), label="|H(k)|")
axes[2].plot(np.abs(estimate), "k.", ms=3, label="pilot estimate")
axes[2].set(xlabel="subcarrier", ylabel="gain", title="Frequency-selective fading")
axes[2].legend()
fig.tight_layout()

plt.show()
Total running time of the script: (0 minutes 0.198 seconds)
