
Note
Go to the end to download the full example code or to run this example in your browser via JupyterLite.
Doyle’s guaranteed margins for LQG: there are none (1978)#
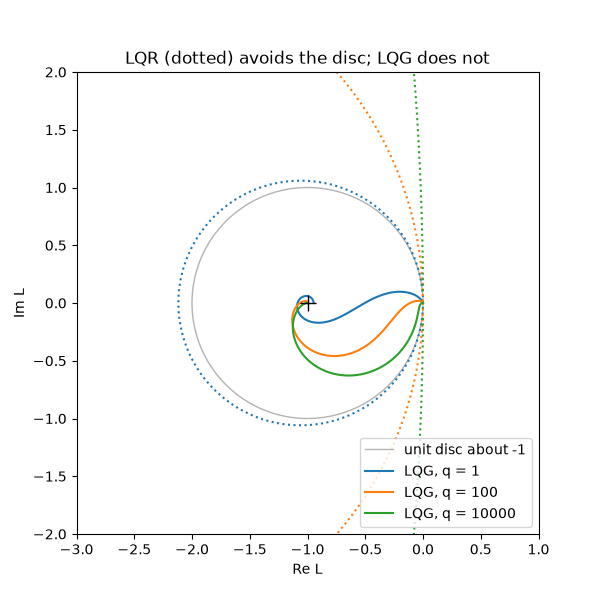
A full-state LQR loop is famously robust: its Nyquist plot never enters the unit disc around \(-1\), so it tolerates a gain anywhere in \([1/2, \infty)\) and a phase change of at least 60°. It seemed natural that an LQR gain fed by a Kalman filter (the LQG controller) would inherit these margins. John Doyle’s 1978 note, whose abstract reads in full “There are none.”, gave a counterexample. As the design weights grow the LQG loop’s margins shrink towards zero, even though each half is optimal.
Doyle’s plant is \(A = [[1, 1], [0, 1]]\), \(B = [0, 1]^\mathsf{T}\),
\(C = [1, 0]\), with state weight and process noise both
\(q\,[1, 1]^\mathsf{T}[1, 1]\) and unit input weight and measurement
noise. Margins are read at the plant input with
stability_margins(), over every
crossover.
import matplotlib.pyplot as plt
import numpy as np
from scipy import signal

from engineeringkit.control_systems import feedback, kalman_gain, lqr, poles, stability_margins, transfer_function

A = np.array([[1.0, 1.0], [0.0, 1.0]])
B = np.array([[0.0], [1.0]])
C = np.array([[1.0, 0.0]])
v = np.array([[1.0], [1.0]])
w = np.logspace(-3, 4, 40000)


def series(*systems):
    num, den = np.array([1.0]), np.array([1.0])
    for n, d in systems:
        num, den = np.polymul(num, n), np.polymul(den, d)
    return transfer_function(num, den)


def tf(A, B, C):
    num, den = signal.ss2tf(A, B, C, np.zeros((C.shape[0], B.shape[1])))
    return num[0], den


plant = tf(A, B, C)
weights = [1, 10, 100, 1000, 10000]
rows = []
for q in weights:
    K, _, _ = lqr(A, B, q * v @ v.T, [[1.0]])
    L, _, _ = kalman_gain(A, C, q * v @ v.T, [[1.0]])
    lqr_loop = series(tf(A, B, K))
    lqg_loop = series(tf(A - B @ K - L @ C, L, K), plant)
    m_lqr, m_lqg = stability_margins(lqr_loop, w), stability_margins(lqg_loop, w)
    rows.append((q, m_lqr, m_lqg))
    print(
        f"q = {q:>5}: LQR gain range [{m_lqr['gain_margins'].max():.3f}, inf), "
        f"PM {abs(m_lqr['phase_margin_deg']):.1f} deg | "
        f"LQG gain range [{m_lqg['gain_margins'].min():.4f}, {m_lqg['gain_margins'].max():.2f}], "
        f"PM {abs(m_lqg['phase_margin_deg']):.2f} deg"
    )

    # Kalman's guarantees for the state-feedback loop
    assert np.all(m_lqr["gain_margins"] <= 0.5) and np.all(np.abs(m_lqr["phase_margins_deg"]) >= 60)
    # Each LQG margin is real: scaling the loop by it puts closed-loop poles on the axis.
    assert np.all(poles(feedback(lqg_loop)).real < 0)
    for wp, gm in zip(m_lqg["phase_cross_frequencies"], m_lqg["gain_margins"]):
        edge = poles(feedback(series((gm * lqg_loop.num, lqg_loop.den))))
        assert np.min(np.abs(edge - 1j * wp)) < 1e-3 * max(1, wp)

lower = np.array([m["gain_margins"].min() for _, _, m in rows])
pm = np.array([abs(m["phase_margin_deg"]) for _, _, m in rows])
assert np.all(np.diff(lower[1:]) > 0) and lower[-1] > 0.99  # the lower gain margin closes on 1
assert np.all(np.diff(pm) < 0) and pm[-1] < 0.1  # and the phase margin on 0
q =     1: LQR gain range [0.472, inf), PM 61.8 deg | LQG gain range [0.9208, 1.98], PM 3.42 deg
q =    10: LQR gain range [0.348, inf), PM 69.6 deg | LQG gain range [0.9141, 3.10], PM 2.30 deg
q =   100: LQR gain range [0.164, inf), PM 80.6 deg | LQG gain range [0.9381, 8.89], PM 0.65 deg
q =  1000: LQR gain range [0.059, inf), PM 86.6 deg | LQG gain range [0.9730, 29.95], PM 0.10 deg
q = 10000: LQR gain range [0.020, inf), PM 88.9 deg | LQG gain range [0.9905, 98.11], PM 0.01 deg
Nyquist plots near -1#
fig, ax = plt.subplots(figsize=(6, 6))
wn = np.logspace(-3, 3, 20000)
theta = np.linspace(0, 2 * np.pi, 200)
ax.plot(-1 + np.cos(theta), np.sin(theta), color="0.7", lw=1, label="unit disc about -1")
for (q, _, _), colour in zip(rows[::2], ("C0", "C1", "C2")):
    K, _, _ = lqr(A, B, q * v @ v.T, [[1.0]])
    L, _, _ = kalman_gain(A, C, q * v @ v.T, [[1.0]])
    lqg_loop = series(tf(A - B @ K - L @ C, L, K), plant)
    for loop, style in ((lqg_loop, "-"), (series(tf(A, B, K)), ":")):
        h = np.polyval(loop.num, 1j * wn) / np.polyval(loop.den, 1j * wn)
        ax.plot(h.real, h.imag, color=colour, ls=style, label=f"LQG, q = {q}" if style == "-" else None)
ax.plot(-1, 0, "k+", ms=12)
ax.set(xlim=(-3, 1), ylim=(-2, 2), aspect="equal", xlabel="Re L", ylabel="Im L", title="LQR (dotted) avoids the disc; LQG does not")
ax.legend(loc="lower right")

plt.show()
Total running time of the script: (0 minutes 0.054 seconds)
