
Note
Go to the end to download the full example code or to run this example in your browser via JupyterLite.
Kirchhoff’s circuit laws and nodal analysis (1845)#
In 1845, as a student in Königsberg, Gustav Kirchhoff stated the two laws
that make any network of conductors solvable: the currents meeting at a
junction sum to zero, and the voltages around any closed loop sum to zero.
Writing the current law at every node, with Ohm’s law for each branch,
gives a linear system \(G\mathbf{v} = \mathbf{i}\), nodal analysis.
Circuit simulators add one row per voltage source, modified nodal
analysis (nodal_analysis()).
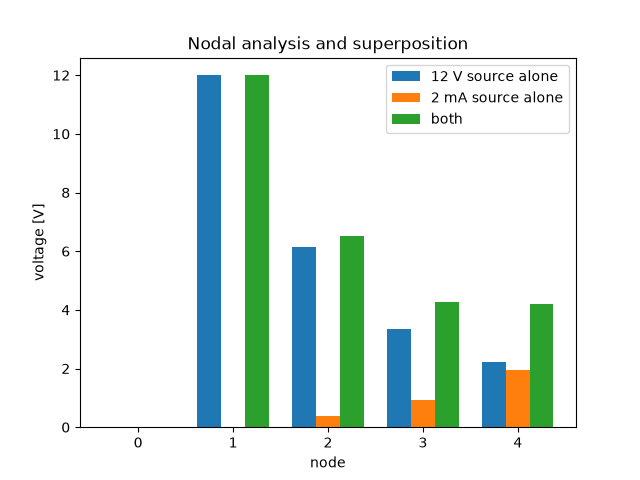
This example solves a two-source ladder network, checks both of
Kirchhoff’s laws on the result, and verifies superposition.
import matplotlib.pyplot as plt
import numpy as np

from engineeringkit.electrical_engineering import nodal_analysis
A ladder with two sources#
A 12 V source at node 1 and a 2 mA current source into node 4 drive a resistor ladder. Node 0 is ground.
resistors = [(1, 2, 1e3), (2, 0, 2e3), (2, 3, 1e3), (3, 0, 2e3), (3, 4, 1e3), (4, 0, 2e3)]
vsrc, isrc = [(1, 0, 12.0)], [(0, 4, 2e-3)]
result = nodal_analysis(4, resistors, current_sources=isrc, voltage_sources=vsrc)
for k, v in enumerate(result.voltages):
    print(f"node {k}: {v:7.4f} V")
print(f"source current {result.source_currents[0] * 1e3:.3f} mA, KCL residual {result.kcl_residual:.1e} A")
node 0:  0.0000 V
node 1: 12.0000 V
node 2:  6.5116 V
node 3:  4.2791 V
node 4:  4.1860 V
source current 5.488 mA, KCL residual 9.4e-19 A
Both laws hold#
The current law is the solver’s residual. The voltage law holds around the loop 0-1-2-0: the source rise equals the two resistor drops.
v = result.voltages
i = result.resistor_currents
assert result.kcl_residual < 1e-15
assert np.isclose(12.0, i[0] * 1e3 + i[1] * 2e3)

# Superposition: each source alone, the other zeroed.
only_v = nodal_analysis(4, resistors, voltage_sources=vsrc)
only_i = nodal_analysis(4, resistors, current_sources=isrc, voltage_sources=[(1, 0, 0.0)])
assert np.allclose(v, only_v.voltages + only_i.voltages)

fig, ax = plt.subplots()
x = np.arange(v.size)
ax.bar(x - 0.25, only_v.voltages, 0.25, label="12 V source alone")
ax.bar(x, only_i.voltages, 0.25, label="2 mA source alone")
ax.bar(x + 0.25, v, 0.25, label="both")
ax.set(xlabel="node", ylabel="voltage [V]", title="Nodal analysis and superposition")
ax.legend()

plt.show()
Total running time of the script: (0 minutes 0.027 seconds)
