
Note
Go to the end to download the full example code or to run this example in your browser via JupyterLite.
The catenary (1691)#
Galileo thought a hanging chain was a parabola. In 1690 Jacob Bernoulli
challenged the readers of Acta Eruditorum to find its true shape, and the
next year three solutions appeared there, by his brother Johann, by
Leibniz and by Huygens: the curve \(y = a(\cosh(x/a) - 1)\), with
\(a = H/w\) the ratio of the horizontal tension to the weight per unit
length (catenary_cable()). A
cable carrying a deck uniform along the span instead hangs in a parabola
(parabolic_cable()), which is
why suspension bridges are designed with parabolic cables. The example
compares the two shapes and shows where the parabola is a good enough
approximation for a cable under its own weight.
import matplotlib.pyplot as plt
import numpy as np

from engineeringkit.structural_engineering import catenary_cable, parabolic_cable
A power line between two towers#
w, L, f = 15.0, 300.0, 9.0  # conductor weight [N/m], span and sag [m]
H, T, length = catenary_cable(w, L, f)
Hp, Tp, length_p = parabolic_cable(w, L, f)
a = H / w
print(f"catenary: H = {H / 1e3:.2f} kN, T_max = {T / 1e3:.2f} kN, length {length:.3f} m")
print(f"parabola: H = {Hp / 1e3:.2f} kN, T_max = {Tp / 1e3:.2f} kN, length {length_p:.3f} m")
assert np.isclose(a * (np.cosh(L / (2 * a)) - 1), f)
assert np.isclose(T, H + w * f)
catenary: H = 18.77 kN, T_max = 18.91 kN, length 300.719 m
parabola: H = 18.75 kN, T_max = 18.88 kN, length 300.718 m
Deep cables: the shapes part company#
ratios = np.linspace(0.02, 1.0, 60)
difference = [catenary_cable(w, L, k * L)[0] / parabolic_cable(w, L, k * L)[0] - 1 for k in ratios]
fig, axes = plt.subplots(1, 2, figsize=(10, 4))
x = np.linspace(-L / 2, L / 2, 201)
for k in (0.1, 0.5):
    Hk = catenary_cable(w, L, k * L)[0]
    ak = Hk / w
    axes[0].plot(x, ak * (np.cosh(x / ak) - np.cosh(L / (2 * ak))), label=f"catenary, sag/span {k}")
    axes[0].plot(x, k * L * (4 * x**2 / L**2 - 1), "--", label=f"parabola, sag/span {k}")
axes[0].set(xlabel="x [m]", ylabel="y [m]", title="Same span and sag")
axes[0].set_aspect("equal")
axes[0].legend(fontsize="small")
axes[1].plot(ratios, 100 * np.array(difference))
axes[1].set(xlabel="sag / span", ylabel="catenary H vs parabola [%]")
fig.tight_layout()
print(f"at sag/span 0.1 the horizontal tensions differ by {100 * difference[np.argmin(np.abs(ratios - 0.1))]:.1f}%")
assert abs(difference[0]) < 0.01 * difference[-1]

plt.show()
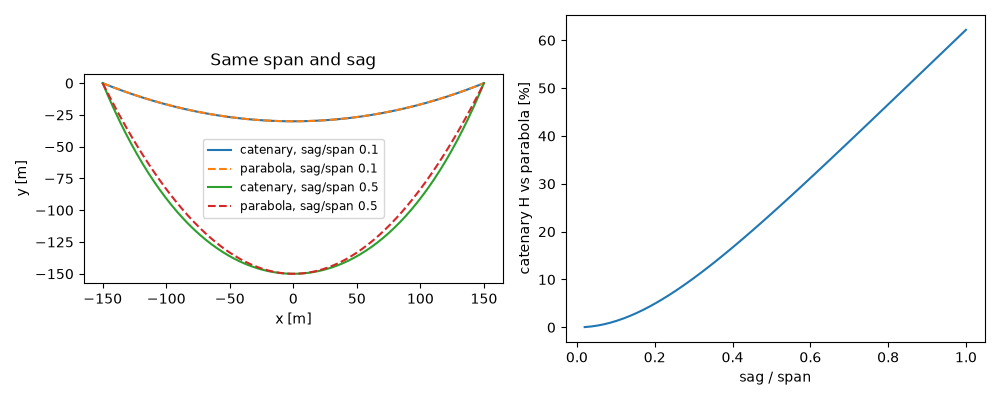
at sag/span 0.1 the horizontal tensions differ by 1.4%
Total running time of the script: (0 minutes 0.118 seconds)
