
Note
Go to the end to download the full example code or to run this example in your browser via JupyterLite.
Rant names exergy (1956)#
Gibbs’s available energy, Gouy’s énergie utilisable and Keenan’s
availability all described the same quantity: the work a stream of energy
could deliver if brought reversibly into equilibrium with the environment.
In 1956 the Slovenian engineer Zoran Rant proposed one short word for it,
exergy, built like energy from the Greek ergon, work. For heat
\(Q\) available at \(T_s\) with surroundings at \(T_0\) it is
\(Q(1 - T_0/T_s)\)
(exergy_heat()). An energy balance
says energy is never lost. An exergy balance shows where the work potential
goes.
import matplotlib.pyplot as plt
import numpy as np

from engineeringkit.thermodynamics import exergy_destruction, exergy_heat

T0 = 283.15
The quality of heat#
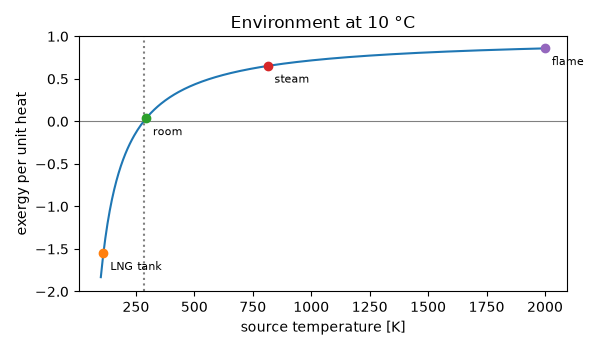
One kilojoule of heat is worth almost a kilojoule of work at a flame temperature and almost nothing at room temperature. Heat below \(T_0\) has negative exergy. Taking heat out of a cold store takes work, so a cold body is a store of work potential too.
T_s = np.linspace(100.0, 2000.0, 400)
fig, ax = plt.subplots(figsize=(6, 3.5))
ax.plot(T_s, exergy_heat(1.0, T_s, T0))
ax.axhline(0, color="gray", lw=0.8)
ax.axvline(T0, color="gray", ls=":")
for name, T in (("LNG tank", 111.0), ("room", 293.15), ("steam", 813.15), ("flame", 2000.0)):
    ax.plot(T, exergy_heat(1.0, T, T0), "o")
    ax.annotate(name, (T, exergy_heat(1.0, T, T0)), textcoords="offset points", xytext=(5, -12), fontsize=8)
ax.set(xlabel="source temperature [K]", ylabel="exergy per unit heat", ylim=(-2, 1), title="Environment at 10 °C")
fig.tight_layout()
assert exergy_heat(1.0, T0, T0) == 0 and exergy_heat(1.0, 111.0, T0) < 0
Heating a house with a boiler#
A gas boiler burns fuel at a flame temperature near 2000 K and delivers 10 kW of heat into a room at 20 °C with 90% energy efficiency. Treating the fuel’s exergy as heat at the flame temperature, the exergy balance shows where the work potential went.
Q_room, eta_boiler, T_flame, T_room = 10e3, 0.9, 2000.0, 293.15
fuel_heat = Q_room / eta_boiler
ex_in = exergy_heat(fuel_heat, T_flame, T0)
ex_room = exergy_heat(Q_room, T_room, T0)
ex_flue = exergy_heat(fuel_heat - Q_room, 400.0, T0)  # flue gas leaves near 400 K
S_gen = Q_room / T_room + (fuel_heat - Q_room) / 400.0 - fuel_heat / T_flame
destroyed = exergy_destruction(T0, S_gen)
print(f"fuel exergy {ex_in / 1e3:.2f} kW, delivered to the room {ex_room / 1e3:.2f} kW")
print(f"lost in the flue gas {ex_flue / 1e3:.2f} kW, destroyed {destroyed / 1e3:.2f} kW")
print(f"energy efficiency {eta_boiler:.0%}, exergy efficiency {ex_room / ex_in:.1%}")
assert np.isclose(ex_in, ex_room + ex_flue + destroyed)
assert ex_room / ex_in < 0.05

fig, ax = plt.subplots(figsize=(6, 2.6))
parts = {"delivered": ex_room, "flue gas": ex_flue, "destroyed": destroyed}
left = 0.0
for name, value in parts.items():
    ax.barh(0, value / 1e3, left=left, label=f"{name} {value / 1e3:.2f} kW")
    left += value / 1e3
ax.set(yticks=[], xlabel="exergy [kW]", title="Where the fuel's work potential goes")
ax.legend(fontsize=8, loc="lower right")
fig.tight_layout()
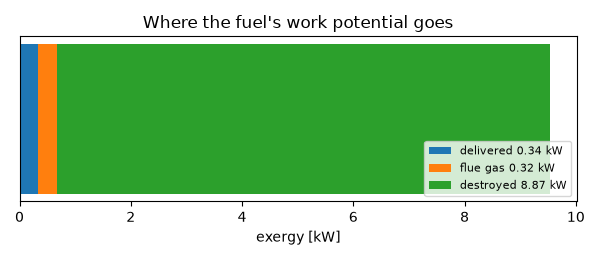
fuel exergy 9.54 kW, delivered to the room 0.34 kW
lost in the flue gas 0.32 kW, destroyed 8.87 kW
energy efficiency 90%, exergy efficiency 3.6%
More than 90% of the work potential is destroyed by mixing the hot flame with room air. A heat pump, or a power station whose waste heat warms the house, delivers the same 10 kW with far less fuel.
plt.show()
Total running time of the script: (0 minutes 0.048 seconds)
