
Note
Go to the end to download the full example code or to run this example in your browser via JupyterLite.
The Joule-Thomson effect (1852)#
Joule’s free expansion of 1845 showed no temperature change, which was too
coarse a test of whether a gas has internal energy apart from its
temperature. From 1852 Joule and William Thomson forced gas steadily
through a porous plug and measured the temperature on each side. The flow
keeps its enthalpy, and real gases came out slightly cooler: air by about a
quarter of a kelvin per atmosphere, carbon dioxide by about one. Hydrogen
came out warmer. For a van der Waals gas at low pressure the coefficient is
\(\mu_{JT} = (2a/RT - b)/c_{p,m}\)
(joule_thomson_coefficient_vdw()).
Attraction (\(a\)) cools the gas and the size of the molecules
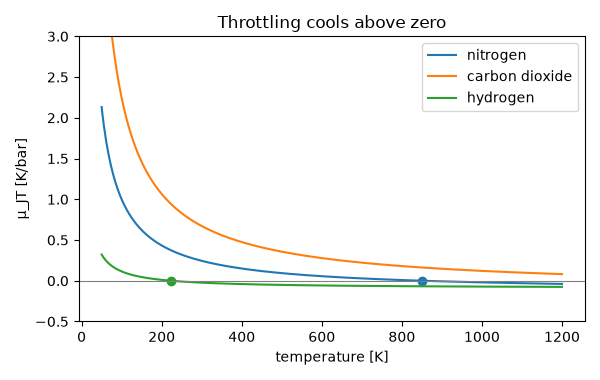
(\(b\)) warms it. The sign changes at the inversion temperature
\(2a/(Rb)\), which Linde’s air liquefier (1895) relied on.
import matplotlib.pyplot as plt
import numpy as np

from engineeringkit.thermodynamics import R_UNIVERSAL, joule_thomson_coefficient_vdw
The porous plug at room temperature#
Van der Waals constants \(a\) [Pa m⁶/mol²], \(b\) [m³/mol] and molar \(c_p\) [J/(mol K)].
gases = {
    "nitrogen": (0.137, 3.87e-5, 29.1),
    "carbon dioxide": (0.364, 4.267e-5, 37.1),
    "hydrogen": (0.02476, 2.661e-5, 28.8),
}
T_room = 293.15
for name, (a, b, cp) in gases.items():
    mu = joule_thomson_coefficient_vdw(T_room, a, b, cp)
    print(f"{name:15s} mu_JT = {mu * 1e5:+.3f} K/bar, inversion at {2 * a / (R_UNIVERSAL * b):6.0f} K")
mu_n2 = joule_thomson_coefficient_vdw(T_room, *gases["nitrogen"])
assert 0.2e-5 < mu_n2 < 0.3e-5  # measured for air: about 0.25 K/bar
assert joule_thomson_coefficient_vdw(T_room, *gases["hydrogen"]) < 0  # hydrogen warms
nitrogen        mu_JT = +0.253 K/bar, inversion at    852 K
carbon dioxide  mu_JT = +0.690 K/bar, inversion at   2052 K
hydrogen        mu_JT = -0.022 K/bar, inversion at    224 K
The van der Waals model catches the sign and the size of the effect. Carbon dioxide comes out at 0.7 K/bar, below the measured 1.1 K/bar, and the predicted inversion temperatures are too high: nitrogen’s real low-pressure inversion is near 620 K and hydrogen’s near 200 K.
Cooling only below the inversion temperature#
T = np.linspace(50.0, 1200.0, 400)
fig, ax = plt.subplots(figsize=(6, 3.8))
for name, (a, b, cp) in gases.items():
    T_inv = 2 * a / (R_UNIVERSAL * b)
    line = ax.plot(T, joule_thomson_coefficient_vdw(T, a, b, cp) * 1e5, label=name)[0]
    if T_inv < T[-1]:
        ax.plot(T_inv, 0, "o", color=line.get_color())
    assert np.isclose(joule_thomson_coefficient_vdw(T_inv, a, b, cp), 0, atol=1e-18)
ax.axhline(0, color="gray", lw=0.8)
ax.set(xlabel="temperature [K]", ylabel="μ_JT [K/bar]", ylim=(-0.5, 3), title="Throttling cools above zero")
ax.legend()
fig.tight_layout()
A throttle valve#
Integrating \(\mathrm{d}T/\mathrm{d}p = \mu_{JT}(T)\) for nitrogen throttled from 10 bar to 1 bar at room temperature gives a few kelvin of cooling. Linde made it useful by precooling the incoming gas with the outgoing cold gas in a counterflow exchanger, so each pass started colder.
p = np.linspace(10e5, 1e5, 901)
T_path = np.empty_like(p)
T_path[0] = T_room
for i in range(1, p.size):
    T_path[i] = T_path[i - 1] + joule_thomson_coefficient_vdw(T_path[i - 1], *gases["nitrogen"]) * (p[i] - p[i - 1])
print(f"nitrogen throttled from 10 to 1 bar: {T_path[0] - T_path[-1]:.2f} K cooler")
assert 2.0 < T_path[0] - T_path[-1] < 2.5

plt.show()
nitrogen throttled from 10 to 1 bar: 2.29 K cooler
Total running time of the script: (0 minutes 0.043 seconds)
