
Note
Go to the end to download the full example code or to run this example in your browser via JupyterLite.
Rayleigh flow: heat addition and thermal choking (1910)#
In “Aerial plane waves of finite amplitude” (1910), Lord Rayleigh combined
the conservation of mass and momentum for a gas in steady one-dimensional
flow. The states they allow form a straight line, \(p + \rho V^2 =\)
const, in the pressure-specific-volume plane: the Rayleigh line. In a
constant-area duct with heat transfer but no friction, the flow moves along
it. rayleigh_flow() gives the ratios to
the sonic state on the line. Heating drives the Mach number towards one, and
rayleigh_choking_heat() is the heat that
chokes a combustor. This example checks the conservation laws and finds the
two special points of the line.
import matplotlib.pyplot as plt
import numpy as np

from engineeringkit.aerodynamics import R_AIR, rayleigh_choking_heat, rayleigh_flow

gamma = 1.4
cp = gamma * R_AIR / (gamma - 1)
M = np.linspace(0.05, 3.5, 700)
state = rayleigh_flow(M, gamma)
Mass and momentum are conserved along the line#
The Rayleigh line in the temperature-entropy plane#
Entropy is largest at \(M = 1\), and the static temperature peaks earlier, at \(M = 1/\sqrt{\gamma}\): between the two, heating a subsonic flow lowers its temperature.
entropy = np.log(state.temperature_ratio) - (gamma - 1) / gamma * np.log(state.pressure_ratio)
M_entropy, M_temperature = M[np.argmax(entropy)], M[np.argmax(state.temperature_ratio)]
print(f"maximum entropy at M = {M_entropy:.3f}; maximum temperature at M = {M_temperature:.3f} (1/sqrt(gamma) = {1 / np.sqrt(gamma):.3f})")
assert np.isclose(M_entropy, 1.0, atol=0.01)
assert np.isclose(M_temperature, 1 / np.sqrt(gamma), atol=0.01)

fig, axes = plt.subplots(1, 2, figsize=(10, 4))
axes[0].plot(entropy, state.temperature_ratio)
axes[0].plot(0, 1, "ko", label="M = 1")
axes[0].plot(entropy[np.argmax(state.temperature_ratio)], state.temperature_ratio.max(), "C3s", label=r"M = $1/\sqrt{\gamma}$")
axes[0].set(xlabel="$(s - s^*)/c_p$", ylabel="$T/T^*$", title="Rayleigh line")
axes[0].legend()
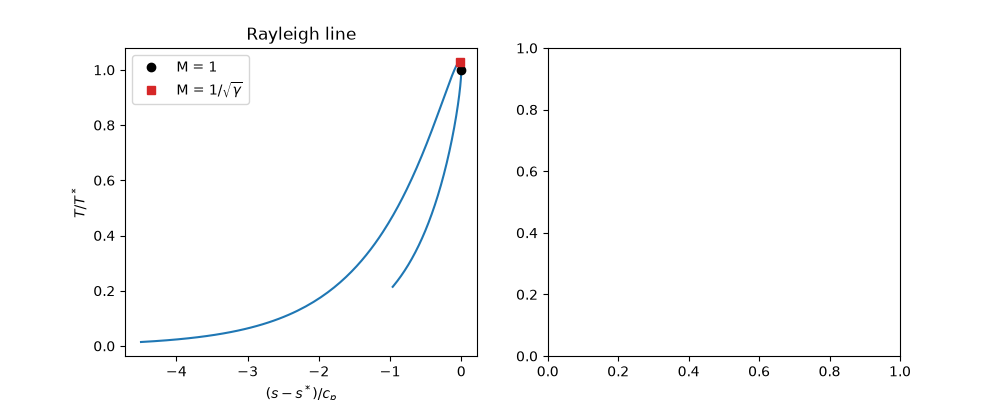
maximum entropy at M = 0.998; maximum temperature at M = 0.845 (1/sqrt(gamma) = 0.845)

<matplotlib.legend.Legend object at 0x7f9782950920>
Heat that chokes a combustor#
T0 = 600.0
inlet = np.linspace(0.1, 0.9, 50)
q = rayleigh_choking_heat(inlet, T0, gamma)
axes[1].plot(inlet, q / 1e3)
axes[1].set(xlabel="inlet Mach number", ylabel="heat to choke [kJ/kg]", title=f"Thermal choking, $T_0$ = {T0:g} K")
fig.tight_layout()
print(f"inlet M = 0.3, T0 = {T0:g} K: {float(rayleigh_choking_heat(0.3, T0)) / 1e3:.0f} kJ/kg chokes the duct")
assert np.isclose(rayleigh_flow(0.3).stagnation_temperature_ratio * (T0 + rayleigh_choking_heat(0.3, T0) / cp), T0)

plt.show()
inlet M = 0.3, T0 = 600 K: 1135 kJ/kg chokes the duct
Total running time of the script: (0 minutes 0.100 seconds)
