
Note
Go to the end to download the full example code or to run this example in your browser via JupyterLite.
Nyquist’s signalling rate: 2B pulses per second#
Harry Nyquist’s “Certain topics in telegraph transmission theory” (1928)
showed that a channel of bandwidth \(B\) can carry at most \(2B\)
independent pulses per second without intersymbol interference
(nyquist_symbol_rate()). Sinc-shaped
pulses spaced \(1/2B\) apart are each zero at all the other sampling
instants, so every pulse can be read without seeing its neighbours. Sending
faster makes the pulses blur together.
import matplotlib.pyplot as plt
import numpy as np

from engineeringkit.communications import bpsk, nyquist_symbol_rate
Sinc pulses at the Nyquist rate#
B = 1000.0
rate = float(nyquist_symbol_rate(B))
rng = np.random.default_rng(1928)
symbols = bpsk(rng.integers(0, 2, 24))
t = np.linspace(-0.002, 0.014, 4001)


def waveform(symbol_rate):
    T = 1 / symbol_rate
    return sum(a * np.sinc(2 * B * (t - k * T)) for k, a in enumerate(symbols)), np.arange(symbols.size) * T


fig, axes = plt.subplots(2, 1, figsize=(8, 5), sharex=True)
for ax, r in zip(axes, [rate, 1.5 * rate], strict=True):
    x, instants = waveform(r)
    samples = np.interp(instants, t, x)
    isi = np.max(np.abs(samples - symbols)[: int(0.012 * r)])
    print(f"{r:6.0f} baud through B = {B:.0f} Hz: worst sampling error {isi:.3f}")
    ax.plot(t * 1e3, x)
    ax.plot(instants * 1e3, samples, "ko", ms=4)
    ax.set(xlim=(-1, 12), title=f"{r:.0f} baud ({r / rate:.1f} x Nyquist)")
axes[-1].set_xlabel("time [ms]")
fig.tight_layout()
x, instants = waveform(rate)
assert np.allclose(np.interp(instants[:20], t, x), symbols[:20], atol=5e-3)

plt.show()
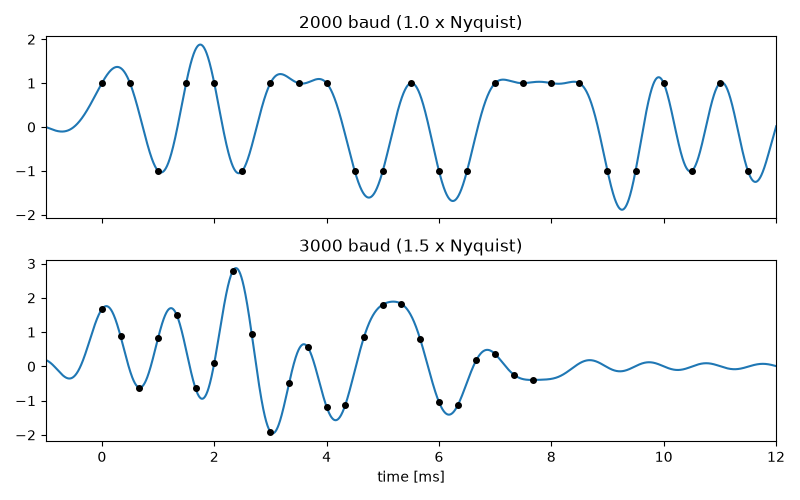
2000 baud through B = 1000 Hz: worst sampling error 0.000
3000 baud through B = 1000 Hz: worst sampling error 1.793
Total running time of the script: (0 minutes 0.162 seconds)
