
Note
Go to the end to download the full example code or to run this example in your browser via JupyterLite.
The Shannon-Hartley capacity of a noisy band-limited channel#
In “Communication in the presence of noise” (1949) Shannon proved that a
channel of bandwidth \(B\) with white Gaussian noise and signal-to-noise
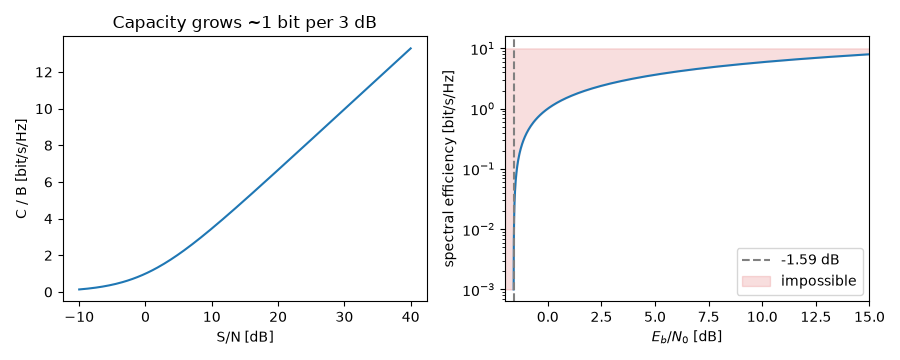
ratio \(S/N\) can carry \(C = B\log_2(1 + S/N)\) bits per second
with arbitrarily small error (shannon_capacity()),
and no more. Writing \(S/N = (E_b/N_0)(C/B)\) gives the minimum energy
per bit for a given spectral efficiency. As bandwidth becomes unlimited the
minimum tends to \(\ln 2\), or -1.59 dB, the Shannon limit.
import matplotlib.pyplot as plt
import numpy as np

from engineeringkit.communications import db, shannon_capacity, spectral_efficiency
A telephone line and a Wi-Fi channel#
for name, B, snr_db in [("telephone", 3.1e3, 35), ("Wi-Fi 20 MHz", 20e6, 25)]:
    C = float(shannon_capacity(B, 10 ** (snr_db / 10)))
    print(f"{name:14s}: C = {C / 1e3:9.1f} kbit/s, {float(spectral_efficiency(C, B)):.2f} bit/s/Hz")
telephone     : C =      36.0 kbit/s, 11.63 bit/s/Hz
Wi-Fi 20 MHz  : C =  166187.5 kbit/s, 8.31 bit/s/Hz
The minimum Eb/N0 for each spectral efficiency#
On the boundary \(\eta = \log_2(1 + \eta E_b/N_0)\), so \(E_b/N_0 = (2^\eta - 1)/\eta\).
eta = np.logspace(-3, np.log10(10), 200)
ebn0_min = (2**eta - 1) / eta
assert np.allclose(shannon_capacity(1.0, eta * ebn0_min), eta)
print(f"Shannon limit as eta -> 0: {float(db(ebn0_min[0])):.3f} dB (ln 2 = {float(db(np.log(2))):.3f} dB)")
fig, axes = plt.subplots(1, 2, figsize=(9, 3.6))
snr = np.linspace(-10, 40, 200)
axes[0].plot(snr, shannon_capacity(1.0, 10 ** (snr / 10)))
axes[0].set(xlabel="S/N [dB]", ylabel="C / B [bit/s/Hz]", title="Capacity grows ~1 bit per 3 dB")
axes[1].semilogy(db(ebn0_min), eta)
axes[1].axvline(float(db(np.log(2))), color="gray", ls="--", label="-1.59 dB")
axes[1].fill_betweenx(eta, db(ebn0_min), -2, color="C3", alpha=0.15, label="impossible")
axes[1].set(xlim=(-2, 15), xlabel="$E_b/N_0$ [dB]", ylabel="spectral efficiency [bit/s/Hz]")
axes[1].legend()
fig.tight_layout()

plt.show()
Shannon limit as eta -> 0: -1.590 dB (ln 2 = -1.592 dB)
Total running time of the script: (0 minutes 0.267 seconds)
