
Note
Go to the end to download the full example code or to run this example in your browser via JupyterLite.
The Nichols chart (1947)#
Nathaniel Nichols, at the MIT Radiation Laboratory during the war, plotted
the open-loop gain in decibels against its phase. On those axes the
closed-loop gain of a unity-feedback loop, \(|L/(1+L)|\), is a fixed
family of contours (nichols_closed_loop()),
so one curve shows both. The highest contour the locus touches is the
closed-loop resonant peak \(M_r\)
(nichols()), and reshaping the locus
away from the critical point \((-180^\circ, 0\text{ dB})\) lowers it.
The chart was published in James, Nichols and Phillips’s Theory of
Servomechanisms (1947). Here a lead compensator
(design_lead()) lifts the phase of
\(L = 4/(s(s+1)(s+2))\) near crossover and pulls the resonant peak
down.
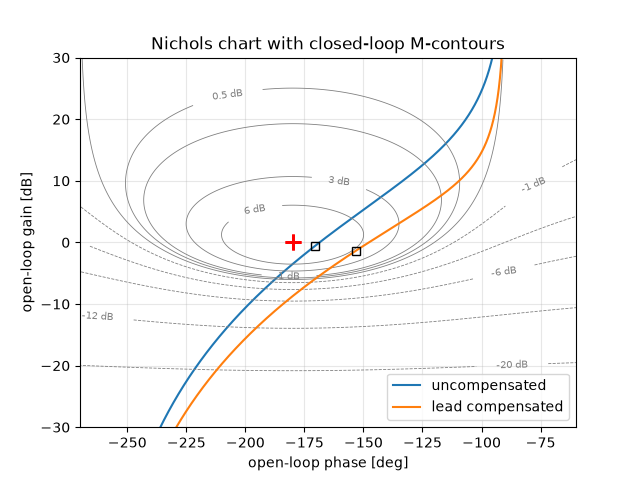
uncompensated: Mr = 14.69 dB at 1.187 rad/s
lead compensated: Mr = 5.54 dB at 1.930 rad/s
import matplotlib.pyplot as plt
import numpy as np

from engineeringkit.control_systems import bode, complementary_sensitivity, design_lead, nichols, transfer_function
from engineeringkit.control_systems.visualizers import plot_nichols

loop = transfer_function([4], [1, 3, 2, 0])
design = design_lead(loop, 50.0)
w = np.logspace(-2, 2, 4000)

ax = plot_nichols(loop, w, label="uncompensated")
plot_nichols(design.compensated_loop, w, ax=ax, label="lead compensated", contours=None)
ax.set(xlim=(-270, -60), ylim=(-30, 30), title="Nichols chart with closed-loop M-contours")

for name, L in (("uncompensated", loop), ("lead compensated", design.compensated_loop)):
    n = nichols(L, w)
    # The resonant peak read from the chart is the peak of the closed-loop Bode magnitude.
    _, mag, _ = bode(complementary_sensitivity(L), w)
    print(f"{name}: Mr = {n['resonant_peak_db']:.2f} dB at {n['resonant_frequency']:.3f} rad/s")
    assert np.isclose(n["resonant_peak_db"], mag.max(), atol=1e-6)
    i = np.argmax(n["closed_gain_db"])
    ax.plot(n["phase_deg"][i], n["gain_db"][i], "ks", mfc="none")

before, after = nichols(loop, w)["resonant_peak_db"], nichols(design.compensated_loop, w)["resonant_peak_db"]
assert after < before - 3
plt.show()
Total running time of the script: (0 minutes 0.190 seconds)
