
Note
Go to the end to download the full example code or to run this example in your browser via JupyterLite.
Swing curves and the equal-area criterion (1926)#
As transmission lines grew longer in the 1920s, generators at their two
ends began to fall out of step after faults. Westinghouse engineers
R. D. Evans and C. F. Wagner computed swing curves, the rotor angle
\(\delta\) against time, by integrating the swing equation
\((2H/\omega_s)\,\ddot\delta = P_m - P_{max}\sin\delta\) step by step
(swing_response()). For one
machine against an infinite bus there is a shortcut: the kinetic energy
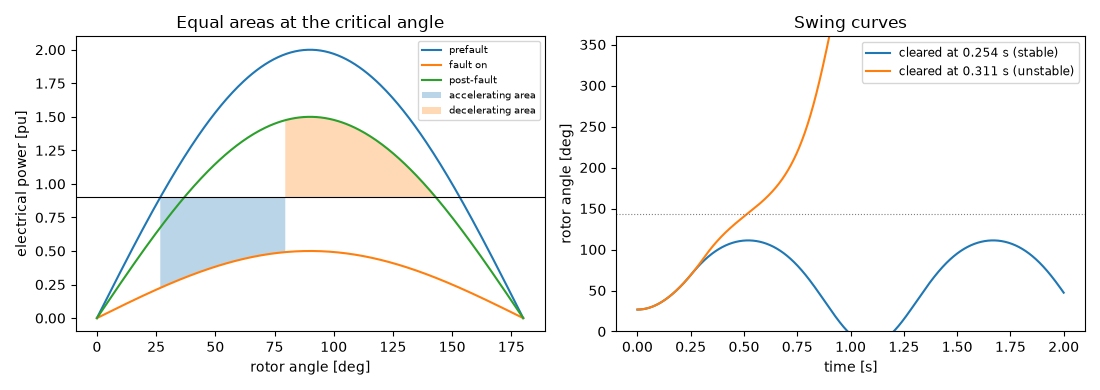
gained while the fault holds the electrical power down (the accelerating
area) must be given back after clearing (the decelerating area) before
\(\delta\) passes the unstable equilibrium. Equating the two areas
gives the critical clearing angle
(equal_area_clearing_angle())
and, for a bolted fault, the critical clearing time
(critical_clearing_time()).
This example checks the criterion against the integrated swing curves.
import matplotlib.pyplot as plt
import numpy as np

from engineeringkit.electrical_engineering import critical_clearing_time, equal_area_clearing_angle, swing_response
The critical clearing angle and time#
A 60 Hz generator with \(H = 5\) s delivers 0.9 pu over a double line (\(P_{max} = 2.0\) pu). A fault on one line drops the transfer to 0.5 pu, and clearing it trips that line, leaving 1.5 pu.
H, Pm, P1, P2, P3 = 5.0, 0.9, 2.0, 0.5, 1.5
d0, dcr = equal_area_clearing_angle(Pm, P1, P2, P3)
dmax = np.pi - np.arcsin(Pm / P3)
print(f"delta0 = {np.degrees(d0):.1f} deg, critical clearing angle {np.degrees(dcr):.1f} deg")
print(f"unstable equilibrium {np.degrees(dmax):.1f} deg")

# The two areas are equal at the critical angle.
accel = Pm * (dcr - d0) + P2 * (np.cos(dcr) - np.cos(d0))
decel = P3 * (np.cos(dcr) - np.cos(dmax)) - Pm * (dmax - dcr)
assert np.isclose(accel, decel)
delta0 = 26.7 deg, critical clearing angle 79.5 deg
unstable equilibrium 143.1 deg
Finding the critical time from the swing curves#
With power still flowing during the fault there is no closed form for the time, so bisect on the clearing time until the first swing just reaches the unstable equilibrium; at that clearing time the angle at clearing is the critical angle.
low, high = 0.05, 1.0
for _ in range(40):
    mid = 0.5 * (low + high)
    low, high = (mid, high) if swing_response(H, Pm, P1, P2, P3, mid, 3.0).stable else (low, mid)
r = swing_response(H, Pm, P1, P2, P3, low, 3.0, n_points=6001)
angle_at_clearing = r.delta[np.searchsorted(r.t, r.clearing_time)]
print(f"critical clearing time {low:.4f} s, angle at clearing {np.degrees(angle_at_clearing):.2f} deg")
assert np.isclose(angle_at_clearing, dcr, atol=np.radians(0.1))
critical clearing time 0.2827 s, angle at clearing 79.53 deg
A bolted three-phase fault#
With \(P_2 = 0\) the angle grows as a parabola and the critical time has a closed form.
tcr = critical_clearing_time(H, Pm, P1, frequency=60.0, p_max_post=P3)
assert swing_response(H, Pm, P1, 0.0, P3, 0.98 * tcr, 3.0).stable
assert not swing_response(H, Pm, P1, 0.0, P3, 1.02 * tcr, 3.0).stable
print(f"bolted fault: critical clearing time {tcr:.3f} s ({60 * tcr:.1f} cycles)")

fig, axes = plt.subplots(1, 2, figsize=(11, 3.9))
delta = np.linspace(0, np.pi, 300)
ax = axes[0]
for p, label in ((P1, "prefault"), (P2, "fault on"), (P3, "post-fault")):
    ax.plot(np.degrees(delta), p * np.sin(delta), label=label)
ax.axhline(Pm, color="k", lw=0.8)
fill = np.linspace(d0, dcr, 100)
ax.fill_between(np.degrees(fill), P2 * np.sin(fill), Pm, alpha=0.3, label="accelerating area")
fill = np.linspace(dcr, dmax, 100)
ax.fill_between(np.degrees(fill), Pm, P3 * np.sin(fill), alpha=0.3, label="decelerating area")
ax.set(xlabel="rotor angle [deg]", ylabel="electrical power [pu]", title="Equal areas at the critical angle")
ax.legend(fontsize="x-small")
for tc in (0.9 * low, 1.1 * low):
    s = swing_response(H, Pm, P1, P2, P3, tc, 2.0)
    axes[1].plot(s.t, np.degrees(s.delta), label=f"cleared at {tc:.3f} s ({'stable' if s.stable else 'unstable'})")
axes[1].axhline(np.degrees(dmax), color="gray", ls=":", lw=0.8)
axes[1].set(xlabel="time [s]", ylabel="rotor angle [deg]", ylim=(0, 360), title="Swing curves")
axes[1].legend(fontsize="small")
fig.tight_layout()

plt.show()
bolted fault: critical clearing time 0.199 s (11.9 cycles)
Total running time of the script: (0 minutes 0.697 seconds)
