
Note
Go to the end to download the full example code or to run this example in your browser via JupyterLite.
Goodman’s mean-stress diagram (1899)#
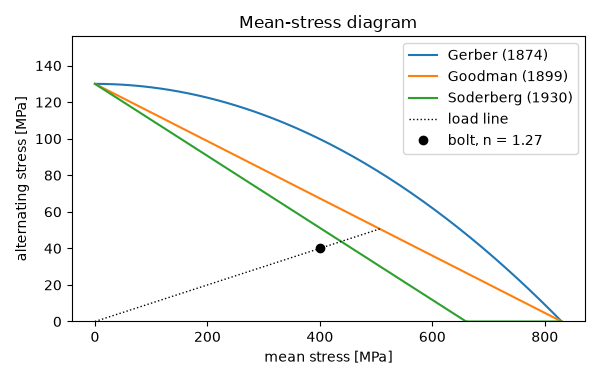
Wöhler’s endurance tests reversed the stress fully, but most machine parts carry a steady stress with an alternating one on top. John Goodman’s Mechanics Applied to Engineering (1899) drew the line that design still uses: the alternating stress a part can carry falls linearly from the endurance limit \(S_e\) at zero mean to nothing at the ultimate strength \(S_{ut}\),
(goodman_safety_factor()). The example
compares it with Gerber’s parabola (1874) and Soderberg’s line (1930) and
reads safety factors along a load line.
import matplotlib.pyplot as plt
import numpy as np

from engineeringkit.materials import goodman_safety_factor
A bolt with a preload#
A steel bolt (\(S_{ut} = 830\) MPa, \(S_e = 130\) MPa for a rolled thread) carries a mean stress of 400 MPa from its preload and an alternating 40 MPa from the external load. Scaling both stresses by \(n\) puts the point on the Goodman line.
Sut, Sy, Se = 830e6, 660e6, 130e6
sa, sm = 40e6, 400e6
n = goodman_safety_factor(sa, sm, Se, Sut)
print(f"Goodman safety factor {n:.3f}")
assert np.isclose(n * sa / Se + n * sm / Sut, 1)
Goodman safety factor 1.266
Three failure lines#
Gerber’s parabola \(\sigma_a/S_e + (\sigma_m/S_{ut})^2 = 1\) follows test data through the middle; Goodman’s line lies inside it, and Soderberg’s, drawn to the yield strength, is the most conservative.
mean = np.linspace(0, Sut, 200)
goodman = Se * (1 - mean / Sut)
gerber = Se * (1 - (mean / Sut) ** 2)
soderberg = Se * np.clip(1 - mean / Sy, 0, None)
assert np.all(soderberg <= goodman + 1e-6) and np.all(goodman <= gerber + 1e-6)
external = np.linspace(10e6, 80e6, 8)
n_external = goodman_safety_factor(external, sm, Se, Sut)
print("safety factor as the alternating stress grows:", np.round(n_external, 2).tolist())
assert np.all(np.diff(n_external) < 0)

fig, ax = plt.subplots(figsize=(6, 3.8))
ax.plot(mean / 1e6, gerber / 1e6, label="Gerber (1874)")
ax.plot(mean / 1e6, goodman / 1e6, label="Goodman (1899)")
ax.plot(mean / 1e6, soderberg / 1e6, label="Soderberg (1930)")
ax.plot([0, n * sm / 1e6], [0, n * sa / 1e6], "k:", lw=1, label="load line")
ax.plot(sm / 1e6, sa / 1e6, "ko", label=f"bolt, n = {n:.2f}")
ax.set(xlabel="mean stress [MPa]", ylabel="alternating stress [MPa]", title="Mean-stress diagram", ylim=(0, 1.2 * Se / 1e6))
ax.legend()
fig.tight_layout()

plt.show()
safety factor as the alternating stress grows: [1.79, 1.57, 1.4, 1.27, 1.15, 1.06, 0.98, 0.91]
Total running time of the script: (0 minutes 0.039 seconds)
