
Note
Go to the end to download the full example code or to run this example in your browser via JupyterLite.
Griffith’s theory of brittle fracture (1920)#
Glass should be as strong as its atomic bonds, about \(E/10\), yet it
breaks at a few hundredths of that. Alan Arnold Griffith (paper read in
1920, published 1921) blamed small cracks. A crack of half-length \(a\)
in a plate under stress \(\sigma\) releases elastic energy
\(\pi\sigma^2a^2/E\) per unit thickness and costs surface energy
\(4a\gamma_s\). It grows when the release outpaces the cost, at
\(\sigma_f = \sqrt{2E\gamma_s/\pi a}\)
(griffith_fracture_stress()). Griffith
confirmed it on glass bulbs and tubes with scratches of known size, and
drawing fresh glass fibres showed strengths approaching the theoretical
value.
import matplotlib.pyplot as plt
import numpy as np

from engineeringkit.materials import griffith_fracture_stress
The energy balance#
At fixed stress the total energy \(U(a) = 4a\gamma_s - \pi\sigma^2a^2/E\) has a maximum. A crack shorter than the maximum would need energy to grow; a longer one runs. The maximum lies exactly where Griffith’s stress equals the applied stress.
E, gamma = 70e9, 1.0
sigma = 100e6
a = np.linspace(1e-7, 2e-5, 4001)
U = 4 * a * gamma - np.pi * sigma**2 * a**2 / E
a_peak = a[np.argmax(U)]
print(f"at {sigma / 1e6:.0f} MPa the energy peaks at a = {1e6 * a_peak:.2f} um")
assert np.isclose(griffith_fracture_stress(E, gamma, a_peak), sigma, rtol=1e-3)
at 100 MPa the energy peaks at a = 4.46 um
Strength against flaw size#
Strength falls as \(1/\sqrt a\). A flaw of a few nanometres is needed to reach the ideal strength; scratches of a few micrometres bring glass down to the 100 MPa range measured in practice.
flaws = np.geomspace(1e-9, 1e-3, 200)
strength = griffith_fracture_stress(E, gamma, flaws)
ideal = E / 10
print(f"1 um flaw: {griffith_fracture_stress(E, gamma, 1e-6) / 1e6:.0f} MPa; ideal strength {ideal / 1e9:.0f} GPa")
assert np.allclose(strength * np.sqrt(flaws), strength[0] * np.sqrt(flaws[0]))

fig, (ax1, ax2) = plt.subplots(1, 2, figsize=(9.5, 3.8))
ax1.plot(1e6 * a, U * 1e6)
ax1.axvline(1e6 * a_peak, color="0.6", ls=":")
ax1.set(xlabel="crack half-length [um]", ylabel="energy [uJ/m]", title=f"Energy balance at {sigma / 1e6:.0f} MPa")
ax2.loglog(1e6 * flaws, strength / 1e6, label="Griffith")
ax2.axhline(ideal / 1e6, color="k", ls="--", label="ideal, E/10")
ax2.set(xlabel="crack half-length [um]", ylabel="fracture stress [MPa]", title="Glass")
ax2.legend()
fig.tight_layout()

plt.show()
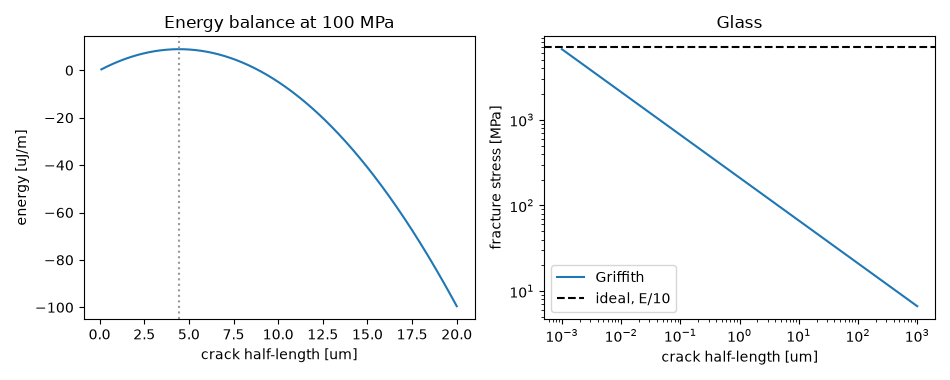
1 um flaw: 211 MPa; ideal strength 7 GPa
Total running time of the script: (0 minutes 0.097 seconds)
