
Note
Go to the end to download the full example code or to run this example in your browser via JupyterLite.
Irwin’s stress intensity factor (1957)#
Griffith’s balance worked for glass but predicted absurdly low strengths for
steel, whose cracks blunt by plastic flow. George Irwin, at the US Naval
Research Laboratory after the brittle failures of welded Liberty ships,
showed that the stresses near every crack tip have the same shape,
\(\sigma_{ij} = K f_{ij}(\theta)/\sqrt{2\pi r}\), scaled by one number,
the stress intensity factor \(K_I = Y\sigma\sqrt{\pi a}\) (1957)
(stress_intensity()). Fracture happens when
\(K_I\) reaches the material’s toughness \(K_{Ic}\), and the
critical crack length follows
(critical_crack_length()). The energy
release rate links the two views, \(\mathcal{G} = K^2/E\).
import matplotlib.pyplot as plt
import numpy as np

from engineeringkit.materials import critical_crack_length, griffith_fracture_stress, stress_intensity
Griffith and Irwin agree#
For an ideally brittle solid the toughness is \(K_{Ic} = \sqrt{2E\gamma_s}\) (plane stress). Irwin’s criterion then gives Griffith’s fracture stress.
E, gamma, a = 70e9, 1.0, 5e-6
Kc_glass = np.sqrt(2 * E * gamma)
sigma_irwin = Kc_glass / stress_intensity(1.0, 1.0, a)
print(f"glass: K_c = {Kc_glass / 1e6:.3f} MPa sqrt(m), fracture stress {sigma_irwin / 1e6:.1f} MPa")
assert np.isclose(sigma_irwin, griffith_fracture_stress(E, gamma, a))
glass: K_c = 0.374 MPa sqrt(m), fracture stress 94.4 MPa
Allowable cracks in two steels#
Edge cracks (\(Y = 1.12\)) in a plate at 60% of yield. A high-strength steel at that fraction of its yield fails from a crack under a millimetre. A tough structural steel tolerates a crack of over 10 cm, but its plastic zone, \(r_p = (K/\sigma_y)^2/2\pi\), is then centimetres across. Linear-elastic fracture mechanics needs the zone to be small compared with the crack and the plate thickness, so tough steels are assessed with elastic-plastic methods (the J-integral, CTOD).
steels = {"structural (Sy 350 MPa, KIc 150)": (350e6, 150e6), "high strength (Sy 1500 MPa, KIc 50)": (1500e6, 50e6)}
fig, ax = plt.subplots(figsize=(6, 3.8))
for name, (sy, Kic) in steels.items():
    stress = 0.6 * sy
    ac = critical_crack_length(Kic, stress, 1.12)
    rp = (Kic / sy) ** 2 / (2 * np.pi)
    print(f"{name}: critical edge crack {1e3 * ac:.1f} mm, plastic zone {1e3 * rp:.2f} mm")
    assert np.isclose(stress_intensity(1.12, stress, ac), Kic)
    cracks = np.geomspace(1e-4, 0.1, 200)
    ax.loglog(1e3 * cracks, Kic / stress_intensity(1.12, 1.0, cracks) / 1e6, label=name)
ax.set(xlabel="edge crack length [mm]", ylabel="fracture stress [MPa]", title="Fracture stress against crack length")
ax.legend()
fig.tight_layout()

plt.show()
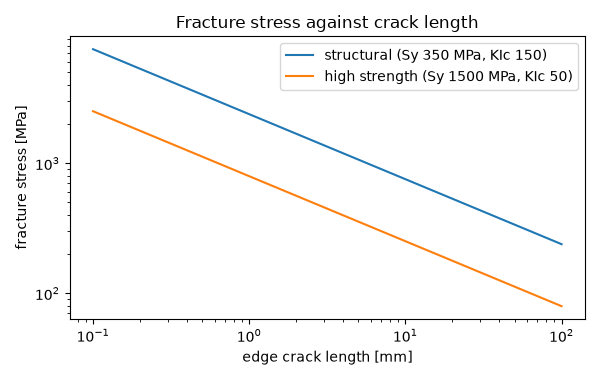
structural (Sy 350 MPa, KIc 150): critical edge crack 129.5 mm, plastic zone 29.23 mm
high strength (Sy 1500 MPa, KIc 50): critical edge crack 0.8 mm, plastic zone 0.18 mm
Total running time of the script: (0 minutes 0.057 seconds)
