
Note
Go to the end to download the full example code or to run this example in your browser via JupyterLite.
Freudenstein’s equation for four-bar synthesis (1954)#
Before computers, linkages that generate a prescribed function were designed by graphical construction. Ferdinand Freudenstein (1954) wrote the four-bar’s loop closure as
which is linear in three link-length ratios. Prescribing three pairs of
input and output angles, the precision points, gives three linear equations
(freudenstein_coefficients()),
and the link lengths follow
(freudenstein_link_lengths()).
The example designs a linkage whose output angle is proportional to
\(\log_{10} x\) for \(1 \le x \le 2\), using Chebyshev spacing of the
precision points to keep the error small between them.
import matplotlib.pyplot as plt
import numpy as np

from engineeringkit.mechanical_engineering import fourbar_output_angle, freudenstein_coefficients, freudenstein_link_lengths
Precision points#
The input crank turns 60 degrees from 40 degrees as \(x\) runs from 1 to 2. The output turns 90 degrees from -60 degrees as \(\log_{10} x\) runs from 0 to \(\log_{10} 2\). Chebyshev spacing puts the three precision points at \(1.5 - 0.5\cos((2j - 1)\pi/6)\).
x0, x1 = 1.0, 2.0


def crank(x):
    return np.radians(40 + 60 * (x - x0) / (x1 - x0))


def rocker(x):
    return np.radians(-60 + 90 * np.log10(x) / np.log10(x1))


xs = (x0 + x1) / 2 - (x1 - x0) / 2 * np.cos((2 * np.arange(1, 4) - 1) * np.pi / 6)
K = freudenstein_coefficients(crank(xs), rocker(xs))
a, b, c, d = freudenstein_link_lengths(K, ground=0.1)
print("precision points x =", np.round(xs, 4).tolist())
print(f"K = {np.round(K, 5).tolist()}")
print(f"crank {1e3 * a:.1f} mm, coupler {1e3 * b:.1f} mm, rocker {1e3 * c:.1f} mm, ground {1e3 * d:.1f} mm")
precision points x = [1.067, 1.5, 1.933]
K = [0.48881, 0.3593, -0.14296]
crank 204.6 mm, coupler 381.6 mm, rocker 278.3 mm, ground 100.0 mm
Check the design by analysis#
Solving the synthesised linkage’s loop closure must return the prescribed output exactly at the precision points. Between them the structural error is small but not zero.
assert np.allclose(fourbar_output_angle(a, b, c, d, crank(xs)), rocker(xs), atol=1e-10)
x = np.linspace(x0, x1, 401)
error = np.degrees(fourbar_output_angle(a, b, c, d, crank(x)) - rocker(x))
print(f"largest structural error {np.max(np.abs(error)):.3f} deg over a 90 deg output range")
assert np.max(np.abs(error)) < 0.05

fig, axes = plt.subplots(1, 2, figsize=(10, 3.8))
axes[0].plot(x, error)
axes[0].plot(xs, 0 * xs, "o", label="precision points")
axes[0].set(xlabel="x", ylabel="output error [deg]", title="Structural error")
axes[0].legend()
for xi in (x0, 1.5, x1):
    t2, t4 = crank(xi), fourbar_output_angle(a, b, c, d, crank(xi))
    A, B = a * np.array([np.cos(t2), np.sin(t2)]), np.array([d + c * np.cos(t4), c * np.sin(t4)])
    axes[1].plot([0, A[0], B[0], d], [0, A[1], B[1], 0], "o-", label=f"x = {xi}")
axes[1].set_aspect("equal")
axes[1].set(xlabel="x [m]", ylabel="y [m]", title="Log-function generator")
axes[1].legend(fontsize=8)
fig.tight_layout()

plt.show()
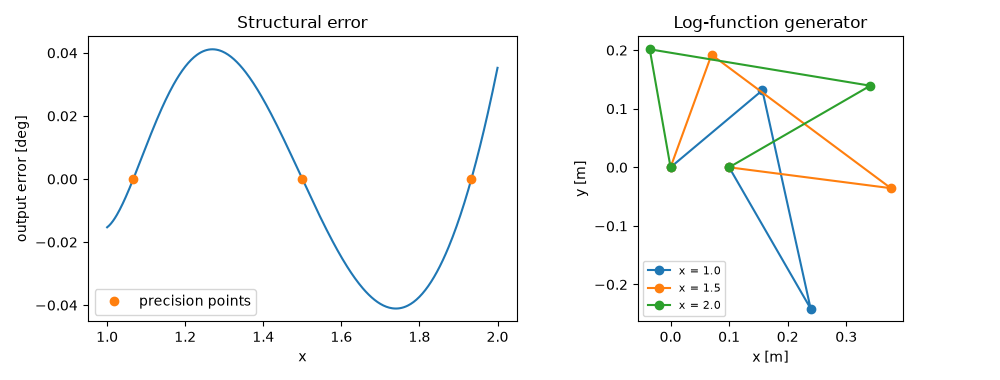
largest structural error 0.041 deg over a 90 deg output range
Total running time of the script: (0 minutes 0.047 seconds)
