
Note
Go to the end to download the full example code or to run this example in your browser via JupyterLite.
Halley’s life table and the hazard rate (1693)#
In 1693 Edmond Halley used five years of births and burials from Breslau to
tabulate how many of 1000 one-year-olds were still alive at each later age.
The fall from one age to the next is the probability of dying in that year,
the first estimate of what reliability engineers call the hazard rate
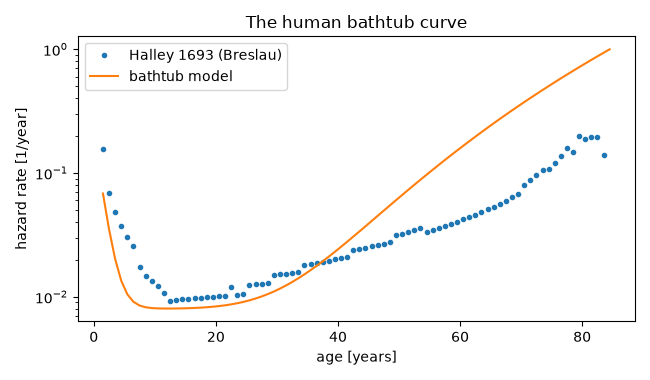
(life_table_hazard()). Halley’s hazard is
high in infancy, lowest around age ten and rises steadily with age: the
bathtub curve (bathtub_hazard()) that
describes many machines as well as people.
import matplotlib.pyplot as plt
import numpy as np

from engineeringkit.reliability import bathtub_hazard, life_table_hazard
Halley’s table#
Persons living at each age from 1 to 84, as printed in the Philosophical Transactions (time unit: years).
# fmt: off
alive = [
    1000, 855, 798, 760, 732, 710, 692, 680, 670, 661, 653, 646, 640, 634,
    628, 622, 616, 610, 604, 598, 592, 586, 579, 573, 567, 560, 553, 546,
    539, 531, 523, 515, 507, 499, 490, 481, 472, 463, 454, 445, 436, 427,
    417, 407, 397, 387, 377, 367, 357, 346, 335, 324, 313, 302, 292, 282,
    272, 262, 252, 242, 232, 222, 212, 202, 192, 182, 172, 162, 152, 142,
    131, 120, 109, 98, 88, 78, 68, 58, 50, 41, 34, 28, 23, 20,
]
# fmt: on
ages = np.arange(1, 85)
hazard = life_table_hazard(ages, alive)
young = int(ages[np.argmin(hazard)])
print(f"hazard at age 1: {hazard[0]:.3f}/yr, lowest {hazard.min():.4f}/yr at age {young}, at age 80: {hazard[79]:.3f}/yr")
hazard at age 1: 0.157/yr, lowest 0.0093/yr at age 12, at age 80: 0.187/yr
A bathtub hazard through the same data#
Infant mortality decaying over a few years, a constant floor and a wear-out term growing as a power of age, fitted by eye.
h = bathtub_hazard(ages + 0.5, early_scale=0.2, early_rate=0.8, random_rate=0.008, wear_scale=2.5e-11, wear_power=5.5)
fig, ax = plt.subplots(figsize=(6.5, 3.8))
ax.semilogy(ages[:-1] + 0.5, hazard, "o", ms=3, label="Halley 1693 (Breslau)")
ax.semilogy(ages + 0.5, h, label="bathtub model")
ax.set(xlabel="age [years]", ylabel="hazard rate [1/year]", title="The human bathtub curve")
ax.legend()
fig.tight_layout()

# The hazard falls through childhood, then rises: a bathtub, not a constant.
assert hazard[0] > 5 * hazard.min() and hazard[78] > 5 * hazard.min()
assert 5 <= young <= 20

plt.show()
Total running time of the script: (0 minutes 0.041 seconds)
