
Note
Go to the end to download the full example code or to run this example in your browser via JupyterLite.
IEC 61508 and safety integrity levels (1998)#
Programmable electronics took over process trips, railway signalling and
machine guards in the 1980s, and nobody could say how safe a software-based
protection system was. The International Electrotechnical Commission’s
answer, IEC 61508 (first parts published 1998), grades each safety
function by the risk reduction it must achieve. For a function that acts
only on rare demands, the measure is its average probability of failure on
demand. A dangerous fault that no self-test detects stays hidden until the
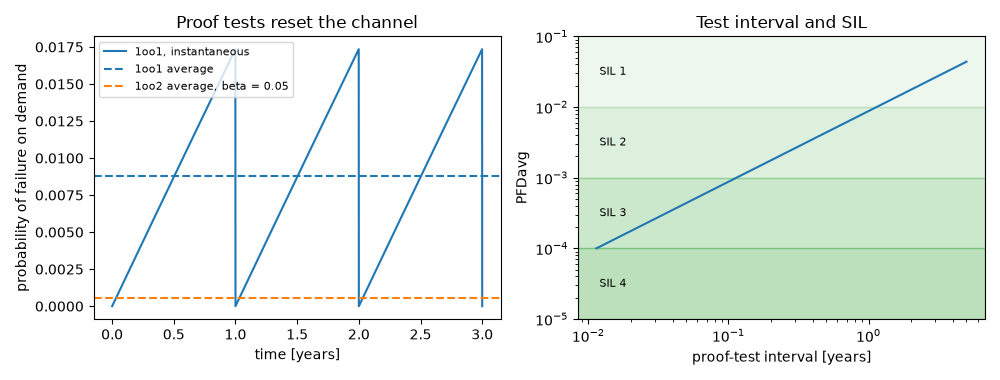
next proof test, so the channel’s unavailability rises from zero after each
test, and over an interval \(T\) it averages
\(\lambda_{DU} T/2\)
(safety_integrity_pfd()). Each decade of
PFDavg is one safety integrity level
(safety_integrity_level()).
import matplotlib.pyplot as plt
import numpy as np
from scipy.integrate import trapezoid

from engineeringkit.reliability import safety_integrity_level, safety_integrity_pfd
One channel, tested once a year#
A pressure trip with \(\lambda_{DU} = 2\times10^{-6}\) per hour (time unit: hours). The exact time average of \(1 - e^{-\lambda t}\) over an interval is \(1 - (1 - e^{-\lambda T})/(\lambda T)\).
lam, T = 2e-6, 8760.0
pfd = safety_integrity_pfd(lam, T)
exact = 1 - (1 - np.exp(-lam * T)) / (lam * T)
print(f"1oo1: PFDavg {pfd:.3e} (exact {exact:.3e}), SIL {safety_integrity_level(pfd)}")
assert np.isclose(pfd, exact, rtol=0.01)
1oo1: PFDavg 8.760e-03 (exact 8.709e-03), SIL 2
Two channels and common cause#
Two independent channels voting one-out-of-two fail together with average probability \((\lambda T)^2/3\). A fraction \(\beta\) of the failures hit both channels at once (same design, same calibration error) and act like a single channel.
beta = 0.05
independent = (lam * T) ** 2 / 3
t = np.linspace(0, T, 20001)
numeric = trapezoid((1 - np.exp(-lam * t)) ** 2, t) / T
pfd_1oo2 = ((1 - beta) * lam * T) ** 2 / 3 + safety_integrity_pfd(beta * lam, T)
print(f"1oo2 without common cause: {independent:.2e} (numerical average {numeric:.2e})")
print(f"1oo2 with beta = {beta}: {pfd_1oo2:.2e}, SIL {safety_integrity_level(pfd_1oo2)}")
assert np.isclose(independent, numeric, rtol=0.02)
assert safety_integrity_level(pfd) == 2 and safety_integrity_level(pfd_1oo2) == 3
1oo2 without common cause: 1.02e-04 (numerical average 1.01e-04)
1oo2 with beta = 0.05: 5.30e-04, SIL 3
The sawtooth and the SIL bands#
time = np.linspace(0, 3 * T, 3001)
since_test = np.mod(time, T)
fig, axes = plt.subplots(1, 2, figsize=(10, 3.8))
axes[0].plot(time / 8760, 1 - np.exp(-lam * since_test), label="1oo1, instantaneous")
axes[0].axhline(pfd, color="C0", ls="--", label="1oo1 average")
axes[0].axhline(pfd_1oo2, color="C1", ls="--", label="1oo2 average, beta = 0.05")
axes[0].set(xlabel="time [years]", ylabel="probability of failure on demand", title="Proof tests reset the channel")
axes[0].legend(fontsize=8)
intervals = np.geomspace(100, 8760 * 5, 200)
axes[1].loglog(intervals / 8760, safety_integrity_pfd(lam, intervals), label="1oo1")
for upper, level in ((1e-1, 1), (1e-2, 2), (1e-3, 3), (1e-4, 4)):
    axes[1].axhspan(upper / 10, upper, alpha=0.08 * level, color="C2")
    axes[1].text(0.012, upper / 3.5, f"SIL {level}", fontsize=8)
axes[1].set(xlabel="proof-test interval [years]", ylabel="PFDavg", ylim=(1e-5, 1e-1), title="Test interval and SIL")
fig.tight_layout()

plt.show()
Total running time of the script: (0 minutes 0.098 seconds)
