
Note
Go to the end to download the full example code or to run this example in your browser via JupyterLite.
WASH-1400: event trees (1975)#
The Reactor Safety Study (WASH-1400, 1975), led by Norman Rasmussen, was
the first attempt to put a number on the risk of a nuclear power plant. Its
method worked forward from each initiating event, such as a pipe break, and
asked in turn whether each safety system worked. Every path through the
resulting event tree is an accident sequence. Its frequency is the
initiator’s frequency times the branch probabilities
(event_tree_probability()). Fault trees
supplied those branch probabilities. The study was criticised for its
uncertainty bounds, but the Three Mile Island accident of 1979 followed a
small-break sequence of the kind it had ranked among the most likely, and
probabilistic risk assessment became standard practice.
import matplotlib.pyplot as plt
import numpy as np

from engineeringkit.reliability import event_tree_probability
A loss-of-coolant event tree#
Illustrative numbers. The initiator is a large pipe break, \(10^{-4}\) per reactor-year (time unit: years). The tree asks, in order, whether the reactor trips, whether emergency core cooling injects, and whether containment heat removal works.
functions = ["reactor trip", "core cooling", "containment heat removal"]
f0 = 1e-4
q = np.array([1e-5, 2e-3, 1e-2])
tree = event_tree_probability(f0, q)
for outcome, frequency in zip(tree.outcomes, tree.frequencies):
    path = "".join("F" if failed else "S" for failed in outcome)
    print(f"{path}  {frequency:.3e} per year")
print(tree.summary())
SSS  9.880e-05 per year
SSF  9.980e-07 per year
SFS  1.980e-07 per year
SFF  2.000e-09 per year
FSS  9.880e-10 per year
FSF  9.980e-12 per year
FFS  1.980e-12 per year
FFF  2.000e-14 per year
{'sequences': 8, 'total_frequency': 0.0001, 'all_success_frequency': 9.880101198e-05}
Core damage frequency#
The core is damaged if the trip or the cooling fails. By inclusion and exclusion this is the two single-function frequencies minus their overlap, which must equal \(f_0[1 - (1-q_1)(1-q_2)]\).
trip, cooling = tree.frequency([0]), tree.frequency([1])
core_damage = trip + cooling - tree.frequency([0, 1])
print(f"core damage frequency {core_damage:.3e} per reactor-year, one in {1 / core_damage:.2e} years")
print(f"containment heat removal also lost: {tree.frequency([1, 2]):.2e} per year")
assert np.isclose(tree.frequencies.sum(), f0)
assert np.isclose(cooling, f0 * q[1])
assert np.isclose(core_damage, f0 * (1 - (1 - q[0]) * (1 - q[1])))

labels = ["".join("F" if failed else "S" for failed in outcome) for outcome in tree.outcomes]
damaged = tree.outcomes[:, 0] | tree.outcomes[:, 1]
fig, ax = plt.subplots(figsize=(7, 4.2))
ax.barh(labels, tree.frequencies, color=np.where(damaged, "C3", "C0"))
ax.set_xscale("log")
ax.invert_yaxis()
ax.set(xlabel="sequence frequency [per reactor-year]", ylabel="trip / cooling / heat removal", title="Event tree, red = core damage")
fig.tight_layout()

plt.show()
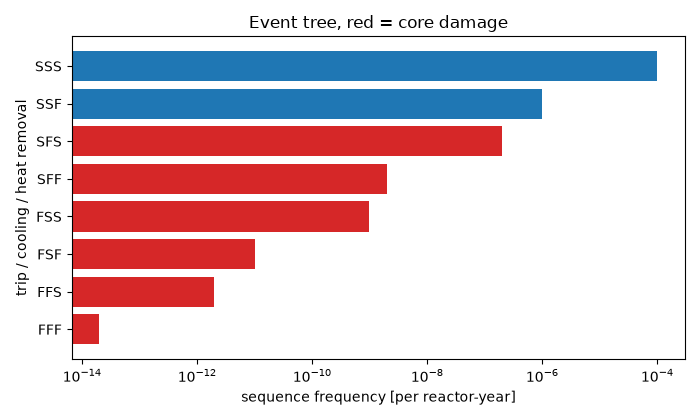
core damage frequency 2.010e-07 per reactor-year, one in 4.98e+06 years
containment heat removal also lost: 2.00e-09 per year
Total running time of the script: (0 minutes 0.037 seconds)
