
Note
Go to the end to download the full example code or to run this example in your browser via JupyterLite.
Freudenthal’s stress-strength interference (1947)#
Alfred Freudenthal (1947) argued that a safety factor, the ratio of mean
strength to mean load, says nothing about safety on its own: two designs
with the same factor can fail at very different rates if their loads and
strengths scatter differently. What matters is the overlap of the two
distributions. For independent normal strength \(S\) and stress
\(s\), \(R = P(S > s) = \Phi(\beta)\) with
\(\beta = (\mu_S - \mu_s)/\sqrt{\sigma_S^2 + \sigma_s^2}\)
(stress_strength_reliability()).
import matplotlib.pyplot as plt
import numpy as np
from scipy.stats import norm

from engineeringkit.reliability import reliability_index_from_probability, stress_strength_reliability
Same safety factor, different scatter#
A steel tie with mean strength 450 MPa carries a mean stress of 300 MPa: a central safety factor of 1.5 in both designs. Stresses in pascals.
designs = {"tight control": (450e6, 20e6, 300e6, 25e6), "loose control": (450e6, 60e6, 300e6, 70e6)}
rng = np.random.default_rng(1947)
x = np.linspace(100e6, 700e6, 400)
fig, axes = plt.subplots(1, 2, figsize=(10, 3.6), sharey=True)
for ax, (name, (mS, sS, ms, ss)) in zip(axes, designs.items()):
    R = float(stress_strength_reliability(mS, sS, ms, ss))
    simulated = np.mean(rng.normal(mS, sS, 1_000_000) > rng.normal(ms, ss, 1_000_000))
    beta = reliability_index_from_probability(1 - R)
    print(f"{name}: safety factor {mS / ms:.2f}, beta = {beta:.2f}, P(failure) = {1 - R:.2e} (simulated {1 - simulated:.2e})")
    assert np.isclose(R, simulated, atol=5e-4)
    ax.plot(x / 1e6, norm.pdf(x, ms, ss) * 1e6, label="stress")
    ax.plot(x / 1e6, norm.pdf(x, mS, sS) * 1e6, label="strength")
    ax.fill_between(x / 1e6, np.minimum(norm.pdf(x, ms, ss), norm.pdf(x, mS, sS)) * 1e6, color="C3", alpha=0.4, label="interference")
    ax.set(title=f"{name}: P(fail) = {1 - R:.1e}", xlabel="stress [MPa]")
axes[0].set_ylabel("probability density [1/MPa]")
axes[0].legend()
fig.tight_layout()
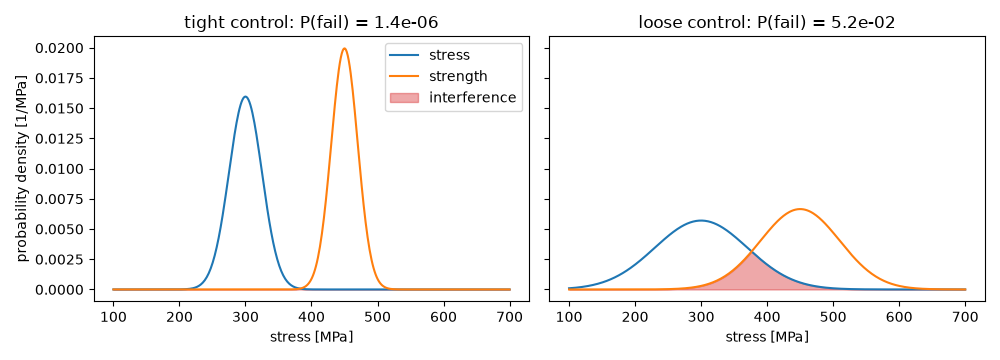
tight control: safety factor 1.50, beta = 4.69, P(failure) = 1.40e-06 (simulated 2.00e-06)
loose control: safety factor 1.50, beta = 1.63, P(failure) = 5.19e-02 (simulated 5.17e-02)
The probability of failure differs by orders of magnitude.
p_tight = 1 - stress_strength_reliability(*designs["tight control"])
p_loose = 1 - stress_strength_reliability(*designs["loose control"])
assert p_loose > 1000 * p_tight

plt.show()
Total running time of the script: (0 minutes 0.069 seconds)
