
Note
Go to the end to download the full example code or to run this example in your browser via JupyterLite.
Von Neumann’s reliable machines from unreliable parts (1956)#
John von Neumann’s 1956 lectures asked how a computer, or a brain, can
work when every component is unreliable. Two answers came out. Active
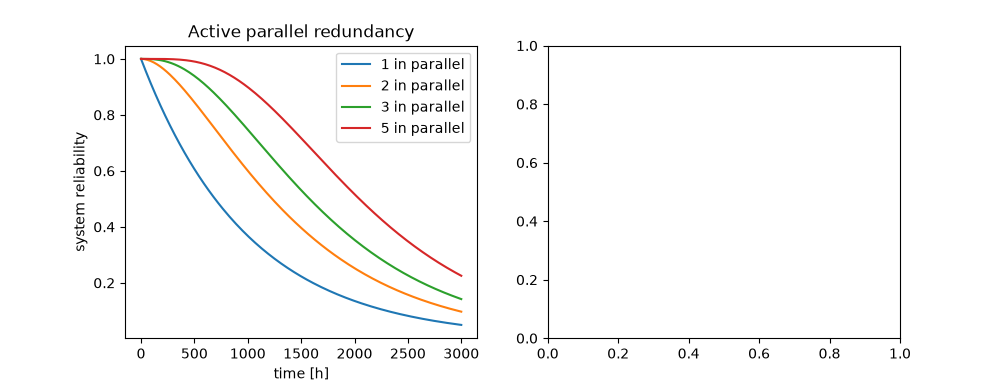
parallel redundancy, \(1 - (1 - r)^n\)
(parallel_reliability()), survives if any
copy survives. For logic, where a wrong output is as bad as none, he used
majority voting: three copies and a voter give \(3r^2 - 2r^3\), and
voting on voters drives reliability toward one, but only if each part is
better than a coin toss, \(r > 1/2\).
import matplotlib.pyplot as plt
import numpy as np

from engineeringkit.reliability import exponential_reliability, k_of_n_reliability, parallel_reliability
Parallel copies over a mission#
Each copy fails at \(10^{-3}\) per hour (time unit: hours).
t = np.linspace(0, 3000, 200)
r = exponential_reliability(t, 1e-3)
fig, axes = plt.subplots(1, 2, figsize=(10, 3.8))
for n in (1, 2, 3, 5):
    axes[0].plot(t, [parallel_reliability(*[ri] * n) for ri in r], label=f"{n} in parallel")
axes[0].set(xlabel="time [h]", ylabel="system reliability", title="Active parallel redundancy")
axes[0].legend()
<matplotlib.legend.Legend object at 0x11120df90>
Majority voting, applied again and again#
Each level of the hierarchy is a 2-out-of-3 vote on the level below.
p = np.linspace(0, 1, 201)
levels = [p]
for _ in range(4):
    levels.append(np.array([k_of_n_reliability(3, 2, float(x)) for x in levels[-1]]))
for i, values in enumerate(levels):
    axes[1].plot(p, values, label=f"{i} levels of voting")
axes[1].set(xlabel="component reliability r", ylabel="system reliability", title="Von Neumann's majority voting")
axes[1].legend()
fig.tight_layout()
for r0 in (0.4, 0.5, 0.9):
    chain = [r0]
    for _ in range(4):
        chain.append(k_of_n_reliability(3, 2, chain[-1]))
    print(f"r = {r0}: " + " -> ".join(f"{x:.4f}" for x in chain))

assert np.isclose(k_of_n_reliability(3, 2, 0.5), 0.5)
assert levels[-1][180] > 0.9999 and levels[-1][80] < levels[0][80] / 3
assert parallel_reliability(0.5, 0.5, 0.5) == 0.875

plt.show()
r = 0.4: 0.4000 -> 0.3520 -> 0.2845 -> 0.1967 -> 0.1009
r = 0.5: 0.5000 -> 0.5000 -> 0.5000 -> 0.5000 -> 0.5000
r = 0.9: 0.9000 -> 0.9720 -> 0.9977 -> 1.0000 -> 1.0000
Total running time of the script: (0 minutes 0.055 seconds)
