
Note
Go to the end to download the full example code or to run this example in your browser via JupyterLite.
Birnbaum’s component importance (1969)#
Which component should be improved first? Birnbaum (1969) defined a
component’s importance as the rate at which system reliability changes with
its reliability, \(I_i = \partial R_s/\partial R_i\). In a series
system that is the product of all the other reliabilities
(birnbaum_importance_series()), so the
weakest link is the most important. The example checks the derivative
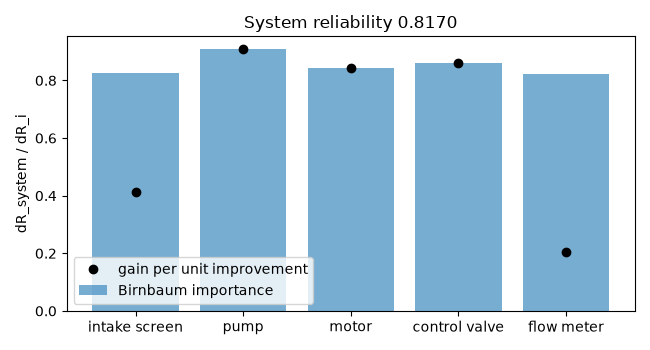
numerically and shows that improving the most important component buys
the most.
import matplotlib.pyplot as plt
import numpy as np

from engineeringkit.reliability import birnbaum_importance_series, series_reliability
Importance of each stage of a pumping train#
names = ["intake screen", "pump", "motor", "control valve", "flow meter"]
R = np.array([0.99, 0.90, 0.97, 0.95, 0.995])
importance = np.array([birnbaum_importance_series(R, i) for i in range(R.size)])
eps = 1e-6
numerical = []
for i in range(R.size):
    up, down = R.copy(), R.copy()
    up[i] += eps
    down[i] -= eps
    numerical.append((series_reliability(*up) - series_reliability(*down)) / (2 * eps))
for name, I, d in zip(names, importance, numerical):
    print(f"{name:14s} I = {I:.4f} (finite difference {d:.4f})")
intake screen  I = 0.8252 (finite difference 0.8252)
pump           I = 0.9077 (finite difference 0.9077)
motor          I = 0.8422 (finite difference 0.8422)
control valve  I = 0.8599 (finite difference 0.8599)
flow meter     I = 0.8211 (finite difference 0.8211)
Spend a fixed improvement on each component in turn#
Remove 0.02 of unreliability from one component at a time.
gain = []
for i in range(R.size):
    better = R.copy()
    better[i] = min(1.0, better[i] + 0.02)
    gain.append(series_reliability(*better) - series_reliability(*R))
fig, ax = plt.subplots(figsize=(6.5, 3.5))
ax.bar(names, importance, alpha=0.6, label="Birnbaum importance")
ax.plot(names, np.array(gain) / 0.02, "ko", label="gain per unit improvement")
ax.set(ylabel="dR_system / dR_i", title=f"System reliability {series_reliability(*R):.4f}")
ax.legend()
fig.tight_layout()

assert np.allclose(importance, numerical)
assert names[int(np.argmax(importance))] == "pump" == names[int(np.argmax(gain))]

plt.show()
Total running time of the script: (0 minutes 0.028 seconds)
