
Note
Go to the end to download the full example code or to run this example in your browser via JupyterLite.
Welch’s averaged periodogram (1967)#
The periodogram of noise does not settle down as the record grows. At
every frequency its standard deviation equals its mean, whatever the
length. Peter Welch (1967) cut the record into overlapping segments,
windowed each, and averaged their periodograms, computed with the new FFT
(welch_psd()). Averaging \(K\)
nearly independent segments divides the variance by about \(K\); the
price is a coarser resolution, \(f_s/L\) for segments of \(L\)
samples.
import matplotlib.pyplot as plt
import numpy as np
from scipy import signal

from engineeringkit.signal_processing import power_spectral_density, welch_psd
The written-out estimate matches SciPy#
rng = np.random.default_rng(1967)
fs, sigma = 1000.0, 1.5
x = rng.normal(0, sigma, 2**15)
f, psd = welch_psd(x, fs, segment_length=256)
f_ref, psd_ref = signal.welch(x, fs, nperseg=256, detrend=False)
assert np.allclose(psd, psd_ref)
Variance falls with the number of segments#
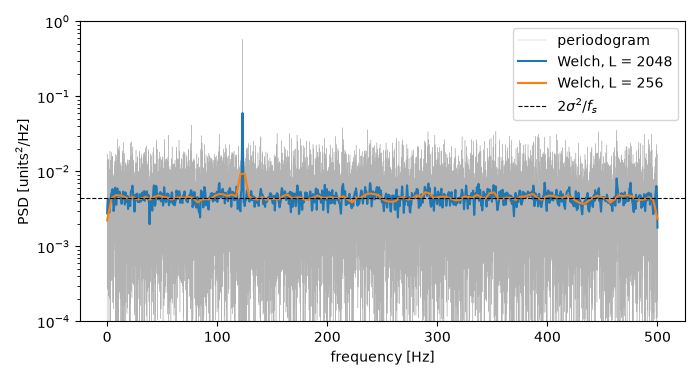
White noise of variance \(\sigma^2\) has a flat one-sided PSD of \(2\sigma^2/f_s\). The scatter of the estimate about that level is measured for the raw periodogram and for Welch’s method with shorter and shorter segments (more segments to average).
level = 2 * sigma**2 / fs
f_raw, p_raw = power_spectral_density(x, fs)
scatter = {"periodogram": np.std(p_raw[1:-1]) / level}
for length in (2048, 512, 128):
    f_w, p_w = welch_psd(x, fs, segment_length=length)
    segments = (x.size - length) // (length // 2) + 1
    relative = scatter[f"{segments} segments of {length}"] = np.std(p_w[1:-1]) / level
    print(f"L = {length:4d}: {segments:3d} segments, resolution {fs / length:5.2f} Hz, relative std {relative:.3f}")
    # Half-overlapped Hann segments are nearly independent: std about 1/sqrt(K), a little more.
    assert 0.9 / np.sqrt(segments) < relative < 1.4 / np.sqrt(segments)
print(f"raw periodogram: relative std {scatter['periodogram']:.3f}")
assert abs(scatter["periodogram"] - 1) < 0.05
assert np.isclose(np.sum(psd) * (f[1] - f[0]), np.var(x), rtol=0.05)
L = 2048:  31 segments, resolution  0.49 Hz, relative std 0.185
L =  512: 127 segments, resolution  1.95 Hz, relative std 0.095
L =  128: 511 segments, resolution  7.81 Hz, relative std 0.045
raw periodogram: relative std 0.994
A tone in noise#
y = x + 0.3 * np.sin(2 * np.pi * 123 * np.arange(x.size) / fs)
fig, ax = plt.subplots(figsize=(7, 3.8))
ax.semilogy(*power_spectral_density(y, fs), lw=0.3, color="0.7", label="periodogram")
for length in (2048, 256):
    ax.semilogy(*welch_psd(y, fs, segment_length=length), label=f"Welch, L = {length}")
ax.axhline(level, color="k", ls="--", lw=0.8, label=r"$2\sigma^2/f_s$")
ax.set(xlabel="frequency [Hz]", ylabel="PSD [units$^2$/Hz]", ylim=(1e-4, 1))
ax.legend()
fig.tight_layout()

plt.show()
Total running time of the script: (0 minutes 0.092 seconds)
