
Note
Go to the end to download the full example code or to run this example in your browser via JupyterLite.
Yule’s autoregressive model (1927)#
Schuster’s periodogram looked for strict periodicities hidden in noise.
George Udny Yule, studying Wolfer’s sunspot numbers, proposed another
picture: a pendulum “pelted with peas”, a damped oscillator kept going by
random shocks, \(x_n = -a_1 x_{n-1} - a_2 x_{n-2} + e_n\). Its cycle
wanders in phase and amplitude, as the sunspot cycle does, and it is fitted
from the record’s correlations, not its Fourier coefficients. Gilbert
Walker (1931) extended the equations to any order. The fitted model gives
a smooth spectrum \(\sigma^2/|A(e^{j\omega})|^2\)
(yule_walker(),
ARModel).
import matplotlib.pyplot as plt
import numpy as np
from scipy import signal

from engineeringkit.signal_processing import power_spectral_density, yule_walker
A disturbed pendulum with an 11-year period#
Poles at radius 0.9 and angle \(2\pi/11\) per year give a damped oscillator; white shocks keep it ringing. 300 years of annual values.
radius, period = 0.9, 11.0
a_true = np.array([1.0, -2 * radius * np.cos(2 * np.pi / period), radius**2])
rng = np.random.default_rng(1927)
x = signal.lfilter([1.0], a_true, rng.normal(size=600))[300:] + 50.0
years = 1700 + np.arange(x.size)
fig, axes = plt.subplots(1, 2, figsize=(11, 4))
axes[0].plot(years, x)
axes[0].set(xlabel="year", ylabel="activity", title="Yule's process: no fixed phase or amplitude")
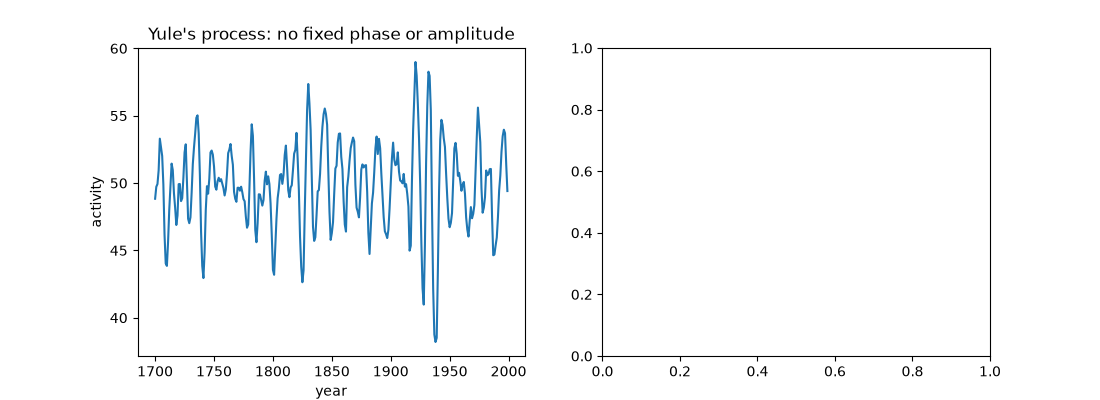
[Text(0.5, 14.833333333333327, 'year'), Text(104.22222222222221, 0.5, 'activity'), Text(0.5, 1.0, "Yule's process: no fixed phase or amplitude")]
Fit by the Yule-Walker equations#
model = yule_walker(x, 2)
print("fitted A(z):", np.round(model.coefficients, 3), " true:", np.round(a_true, 3))
print(model.summary())
poles = np.roots(model.coefficients)
fitted_period = 2 * np.pi / np.abs(np.angle(poles[0]))
print(f"pole radius {abs(poles[0]):.3f}, period {fitted_period:.1f} years")
fitted A(z): [ 1.    -1.516  0.812]  true: [ 1.    -1.514  0.81 ]
{'order': 2, 'noise_variance': 1.0905233922949178, 'prediction_gain': 9.765797731115361, 'stable': True}
pole radius 0.901, period 11.0 years
AR spectrum against the periodogram#
The periodogram of 300 values is ragged at every frequency; the two-parameter model gives a smooth peak at the same place.
f, P = power_spectral_density(x, 1.0)
f_ar, P_ar = model.psd(fs=1.0, n=1024)
true_psd = 2 / np.abs(np.exp(-2j * np.pi * np.outer(f_ar, np.arange(3))) @ a_true) ** 2
axes[1].semilogy(f[1:], P[1:], color="0.7", lw=0.7, label="periodogram")
axes[1].semilogy(f_ar, P_ar, label="AR(2) fit")
axes[1].semilogy(f_ar, true_psd, "k--", lw=0.8, label="true spectrum")
axes[1].set(xlabel="frequency [1/year]", ylabel="PSD [units²·year]", title="Spectrum")
axes[1].legend()
fig.tight_layout()
peak_period = 1 / f_ar[np.argmax(P_ar)]
print(f"AR spectrum peaks at a period of {peak_period:.1f} years")
assert np.allclose(model.coefficients, a_true, atol=0.06)
assert abs(fitted_period - period) < 1.0 and abs(peak_period - period) < 1.5

plt.show()
AR spectrum peaks at a period of 11.2 years
Total running time of the script: (0 minutes 0.200 seconds)
