
Note
Go to the end to download the full example code or to run this example in your browser via JupyterLite.
Engesser’s tangent-modulus load (1889)#
Tests on real columns of intermediate length failed well below Euler’s
load. Friedrich Engesser (1889) argued that once the stress passes the
proportional limit, a column bends against the material’s tangent
modulus \(E_t = d\sigma/d\varepsilon\) and not against \(E\), so
\(P_t = \pi^2E_tI/(KL)^2\). Since \(E_t\) depends on the stress
it creates, the buckling stress solves
\(\sigma = \pi^2E_t(\sigma)/(KL/r)^2\)
(tangent_modulus_load()).
Engesser later proposed a “double-modulus” load, and Shanley (1947) showed
that the tangent-modulus load is the one at which a real column starts to
bend. The example builds the column curve of an aluminium alloy with a
Ramberg-Osgood stress-strain law and checks the computed stresses against
the defining equation.
import matplotlib.pyplot as plt
import numpy as np

from engineeringkit.structural_engineering import euler_buckling_load, slenderness_ratio, tangent_modulus_load
A rounded stress-strain curve#
Ramberg and Osgood’s law, \(\varepsilon = \sigma/E + 0.002(\sigma/\sigma_{0.2})^n\), gives \(1/E_t = 1/E + 0.002\,n\,\sigma^{n-1}/\sigma_{0.2}^n\).
E, s02, n = 70e9, 270e6, 15.0  # 6061-T6 aluminium


def tangent(sigma):
    return 1.0 / (1.0 / E + 0.002 * n * sigma ** (n - 1) / s02**n)


sigma = np.linspace(0, 1.1 * s02, 300)
strain = sigma / E + 0.002 * (sigma / s02) ** n
The column curve#
A 50 mm square tube with 3 mm walls, pinned at both ends.
b, t = 0.05, 0.003
A = b**2 - (b - 2 * t) ** 2
I = (b**4 - (b - 2 * t) ** 4) / 12
lengths = np.linspace(0.3, 4.0, 60)
P_t = np.array([tangent_modulus_load(tangent, I, L, area=A) for L in lengths])
P_e = euler_buckling_load(E, I, lengths)
lam = slenderness_ratio(lengths, 1.0, np.sqrt(I / A))

# Check: each stress satisfies Engesser's equation and never exceeds Euler's.
stress = P_t / A
assert np.allclose(stress, np.pi**2 * tangent(stress) / lam**2, rtol=1e-9)
assert np.all(P_t <= P_e * (1 + 1e-12))
long = lengths[-1]
print(f"L = {long} m: tangent-modulus load {P_t[-1] / 1e3:.1f} kN, Euler {P_e[-1] / 1e3:.1f} kN")
assert np.isclose(P_t[-1], P_e[-1], rtol=1e-3)  # slender: still elastic
print(f"L = {lengths[0]} m: tangent-modulus load {P_t[0] / 1e3:.1f} kN, Euler {P_e[0] / 1e3:.1f} kN")
assert P_t[0] < 0.5 * P_e[0]  # stocky: the tangent modulus governs

fig, axes = plt.subplots(1, 2, figsize=(10, 3.5))
axes[0].plot(1e3 * strain, sigma / 1e6, label=r"$\sigma(\varepsilon)$")
axes[0].plot(1e3 * strain, tangent(sigma) / E * s02 / 1e6, "--", label=r"$E_t/E \times \sigma_{0.2}$")
axes[0].set(xlabel="strain [mm/m]", ylabel="stress [MPa]", title="Ramberg-Osgood aluminium")
axes[0].legend()
axes[1].plot(lam, P_e / A / 1e6, "--", label="Euler")
axes[1].plot(lam, stress / 1e6, label="Engesser tangent modulus")
axes[1].axhline(s02 / 1e6, color="gray", ls=":")
axes[1].set(xlabel="slenderness L/r [-]", ylabel="buckling stress [MPa]", ylim=(0, 400))
axes[1].legend()
fig.tight_layout()

plt.show()
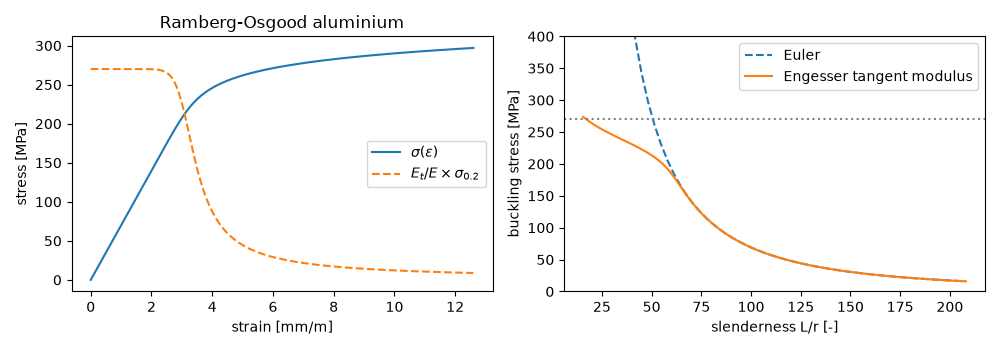
L = 4.0 m: tangent-modulus load 9.0 kN, Euler 9.0 kN
L = 0.3 m: tangent-modulus load 154.3 kN, Euler 1600.5 kN
Total running time of the script: (0 minutes 0.059 seconds)
