
Note
Go to the end to download the full example code or to run this example in your browser via JupyterLite.
Young’s eccentric column (1807)#
No column is loaded exactly on its axis. Thomas Young (1807) analysed a
column loaded at an eccentricity \(e\): the load bends it, the bending
adds to the eccentricity, and the peak stress follows the secant formula
(secant_formula_stress()),
The stress grows faster than the load, so a factor of safety must be put
on the load, not on the stress. Solved for the load at first yield
(secant_formula_load()), it
gives a family of column curves that start below the squash load and
approach Euler’s hyperbola. The attribution to Young follows the
secondary literature; the original lectures were not consulted.
import matplotlib.pyplot as plt
import numpy as np

from engineeringkit.structural_engineering import euler_buckling_load, secant_formula_load, secant_formula_stress
Stress against load: not proportional#
E, sy, A, r, c, L = 200e9, 250e6, 5e-3, 0.05, 0.1, 6.0
P_euler = euler_buckling_load(E, A * r**2, L)
P = np.linspace(0, 0.95, 200) * P_euler
stress = secant_formula_stress(np.maximum(P, 1.0), A, 0.02, c, r, L, E)
half = secant_formula_stress(P_euler / 2, A, 0.02, c, r, L, E)
print(f"Euler load {P_euler / 1e3:.0f} kN; at half of it the stress is {half / 1e6:.0f} MPa")
assert secant_formula_stress(P_euler / 2, A, 0.02, c, r, L, E) > 2 * secant_formula_stress(P_euler / 4, A, 0.02, c, r, L, E)
Euler load 685 kN; at half of it the stress is 192 MPa
Column curves for several eccentricity ratios#
slenderness = np.linspace(10, 250, 120)
fig, ax = plt.subplots(figsize=(6, 4))
for ratio in (0.0, 0.1, 0.3, 0.6, 1.0):
    e = ratio * r**2 / c
    curve = [secant_formula_load(sy, A, e, c, r, k * r, E) / A for k in slenderness]
    ax.plot(slenderness, np.array(curve) / 1e6, label=f"ec/r² = {ratio}")
ax.plot(slenderness, np.minimum(np.pi**2 * E / slenderness**2, sy) / 1e6, "k--", lw=0.8, label="Euler / yield")
ax.set(xlabel="slenderness KL/r", ylabel="average stress P/A at first yield [MPa]", ylim=(0, 270))
ax.legend()
fig.tight_layout()

P_yield = secant_formula_load(sy, A, 0.02, c, r, L, E)
print(f"e = 20 mm: first yield at {P_yield / 1e3:.0f} kN, {P_yield / min(sy * A, P_euler):.0%} of the ideal column")
assert np.isclose(secant_formula_stress(P_yield, A, 0.02, c, r, L, E), sy)

plt.show()
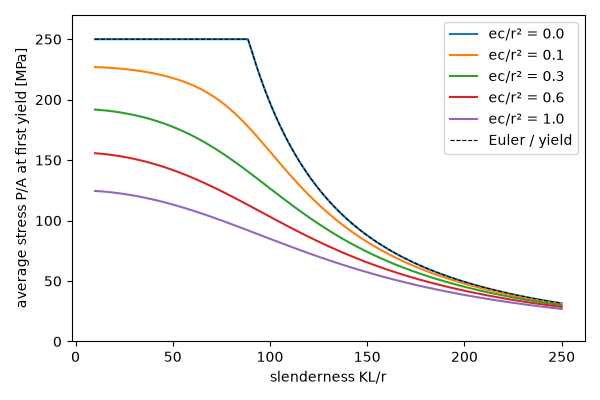
e = 20 mm: first yield at 395 kN, 58% of the ideal column
Total running time of the script: (0 minutes 0.205 seconds)
