
Note
Go to the end to download the full example code or to run this example in your browser via JupyterLite.
Diesel’s compression-ignition cycle (1893)#
Rudolf Diesel’s Theorie und Konstruktion eines rationellen Wärmemotors
(1893) set out to approach Carnot’s efficiency by compressing air alone so
hard that injected fuel ignites by itself. Because there is no fuel in the
cylinder during compression, a diesel cannot knock and can use compression
ratios of 15-22. The fuel burns while the piston moves, which the
air-standard Diesel cycle idealizes as heat added at constant pressure up
to a cutoff ratio \(r_c = v_3/v_2\)
(diesel_efficiency()).
import matplotlib.pyplot as plt
import numpy as np

from engineeringkit.thermodynamics import diesel_efficiency, isentropic_temperature_ratio, otto_efficiency, thermal_efficiency
Four states from the first law#
Compression ratio 18, cutoff ratio 2. Heat in is \(c_p(T_3 - T_2)\) at constant pressure, heat out \(c_v(T_4 - T_1)\) at constant volume.
R, gamma, r, rc, T1 = 287.0, 1.4, 18.0, 2.0, 300.0
cv, cp = R / (gamma - 1), gamma * R / (gamma - 1)
T2 = T1 * r ** (gamma - 1)
T3 = T2 * rc
T4 = T3 * (rc / r) ** (gamma - 1)
eta = thermal_efficiency(cp * (T3 - T2), cv * (T4 - T1))
print(f"T2 = {T2:.0f} K (autoignition), T3 = {T3:.0f} K, T4 = {T4:.0f} K")
print(f"efficiency from the states {eta:.4f}, from the formula {diesel_efficiency(r, rc):.4f}")
assert np.isclose(eta, diesel_efficiency(r, rc))
assert np.isclose(T2 / T1, isentropic_temperature_ratio(r**gamma, gamma))
T2 = 953 K (autoignition), T3 = 1907 K, T4 = 792 K
efficiency from the states 0.6316, from the formula 0.6316
Diesel against Otto#
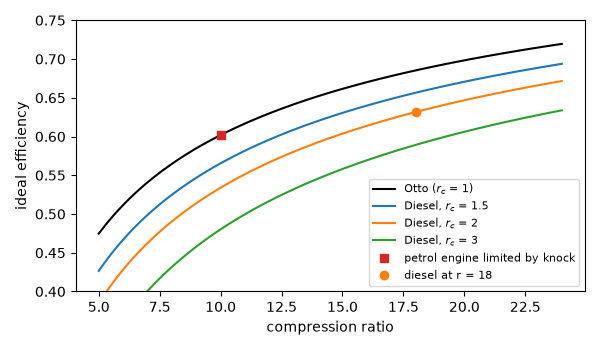
At the same compression ratio the Otto cycle wins: constant-pressure heat addition takes in part of the heat at a lower temperature. A longer cutoff (more fuel, more power) costs efficiency. But a diesel at 18 beats a petrol engine held to 10 by knock.
ratios = np.linspace(5, 24, 96)
fig, ax = plt.subplots(figsize=(6, 3.5))
ax.plot(ratios, otto_efficiency(ratios), "k", label="Otto ($r_c$ = 1)")
for cutoff in (1.5, 2.0, 3.0):
    ax.plot(ratios, [diesel_efficiency(x, cutoff) for x in ratios], label=f"Diesel, $r_c$ = {cutoff:g}")
ax.plot(10, otto_efficiency(10), "s", color="C3", label="petrol engine limited by knock")
ax.plot(r, diesel_efficiency(r, rc), "o", color="C1", label="diesel at r = 18")
ax.set(xlabel="compression ratio", ylabel="ideal efficiency", ylim=(0.4, 0.75))
ax.legend(fontsize=8)
fig.tight_layout()
assert all(diesel_efficiency(x, 2.0) < otto_efficiency(x) for x in ratios)
assert diesel_efficiency(r, rc) > otto_efficiency(10)

plt.show()
Total running time of the script: (0 minutes 0.046 seconds)
