
Note
Go to the end to download the full example code or to run this example in your browser via JupyterLite.
Antoine’s vapour-pressure equation (1888)#
The integrated Clausius-Clapeyron relation makes \(\log p\) linear in
\(1/T\). Measured vapour pressures bend away from that line because the
latent heat falls as the temperature rises. In 1888 Charles Antoine, a
French naval engineer, added a third constant to the temperature,
\(\log_{10} p = A - B/(C + T)\)
(antoine_vapor_pressure()). It fits
most liquids to within a fraction of a percent over a range of 100 K, and
tables of Antoine constants are still standard in chemical engineering. The
example fits both forms to IAPWS-IF97 water and compares them.
import matplotlib.pyplot as plt
import numpy as np

from engineeringkit.thermodynamics import antoine_vapor_pressure, clausius_clapeyron_pressure, saturation_pressure
Fitting the constants#
Multiplying through by \(C + T\) gives \(T\log_{10}p = (AC - B) + AT - C\log_{10}p\), which is linear in \(AC - B\), \(A\) and \(C\), so least squares fits all three at once. The two-constant Clausius-Clapeyron fit is a line in \(1/T\).
T = np.linspace(274.15, 373.15, 100)
log_p = np.log10(saturation_pressure(T))
design = np.column_stack([np.ones_like(T), T, -log_p])
(k0, A, C), *_ = np.linalg.lstsq(design, T * log_p, rcond=None)
B = A * C - k0
print(f"Antoine fit for p in Pa and T in K: A = {A:.4f}, B = {B:.2f} K, C = {C:.2f} K")

slope, intercept = np.polyfit(1 / T, np.log(saturation_pressure(T)), 1)
h_over_R = -slope
T_ref = 323.15
p_ref = np.exp(intercept + slope / T_ref)
p_antoine = antoine_vapor_pressure(T, A, B, C)
p_cc = clausius_clapeyron_pressure(T, T_ref, p_ref, h_over_R * 461.526, 461.526)
err_antoine = np.max(np.abs(p_antoine / saturation_pressure(T) - 1))
err_cc = np.max(np.abs(p_cc / saturation_pressure(T) - 1))
print(f"largest error from 1 to 100 °C: Antoine {err_antoine:.3%}, Clausius-Clapeyron {err_cc:.2%}")
assert err_antoine < 0.003 < 0.03 < err_cc
Antoine fit for p in Pa and T in K: A = 10.1989, B = 1732.62 K, C = -39.45 K
largest error from 1 to 100 °C: Antoine 0.237%, Clausius-Clapeyron 3.95%
Tabulated constants#
The classic constants for water, 8.07131, 1730.63 and 233.426, are for mmHg and °C. Adding \(\log_{10}133.322\) to \(A\) and subtracting 273.15 from \(C\) converts them to Pa and K.
A_tab, B_tab, C_tab = 8.07131 + np.log10(133.322), 1730.63, 233.426 - 273.15
p_tab = antoine_vapor_pressure(T, A_tab, B_tab, C_tab)
p_boil = antoine_vapor_pressure(373.15, A_tab, B_tab, C_tab)
print(f"tabulated constants at 100 °C: {p_boil:.0f} Pa (IF97 {float(saturation_pressure(373.15)):.0f} Pa)")
assert np.max(np.abs(p_tab / saturation_pressure(T) - 1)) < 0.01

fig, axes = plt.subplots(1, 2, figsize=(10, 3.8))
axes[0].plot(T - 273.15, saturation_pressure(T) / 1e3, "k", label="IAPWS-IF97")
axes[0].plot(T[::8] - 273.15, p_antoine[::8] / 1e3, "o", label="Antoine fit")
axes[0].set(xlabel="temperature [°C]", ylabel="vapour pressure [kPa]", title="Water")
axes[0].legend()
for p_fit, label in ((p_cc, "Clausius-Clapeyron (2 constants)"), (p_antoine, "Antoine (3 constants)"), (p_tab, "Antoine, tabulated")):
    axes[1].plot(T - 273.15, (p_fit / saturation_pressure(T) - 1) * 100, label=label)
axes[1].axhline(0, color="gray", lw=0.8)
axes[1].set(xlabel="temperature [°C]", ylabel="error against IF97 [%]")
axes[1].legend(fontsize=8)
fig.tight_layout()

plt.show()
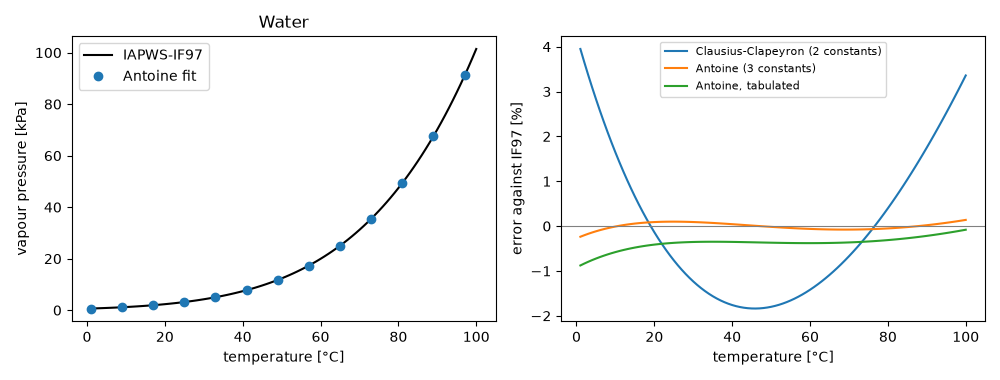
tabulated constants at 100 °C: 101336 Pa (IF97 101418 Pa)
Total running time of the script: (0 minutes 0.051 seconds)
