
Note
Go to the end to download the full example code or to run this example in your browser via JupyterLite.
Pitzer’s acentric factor (1955)#
Van der Waals’s law of corresponding states says that all fluids share one
compressibility chart in reduced temperature and pressure. That holds for
argon, krypton and xenon but fails for larger, less spherical molecules.
Kenneth Pitzer and his co-workers at Berkeley added a third parameter in 1955,
the acentric factor
\(\omega = -\log_{10}[p_s(0.7\,T_c)/p_c] - 1\)
(pitzer_acentric_factor()). It is zero
for the simple fluids, whose reduced vapour pressure at \(T_r = 0.7\) is
almost exactly 0.1. The compressibility factor
(compressibility_factor()) is then
\(Z = Z^0 + \omega Z^1\); at moderate pressure, the second-virial form
(pitzer_virial_compressibility()).
import matplotlib.pyplot as plt
import numpy as np

from engineeringkit.thermodynamics import (
    peng_robinson_compressibility,
    pitzer_acentric_factor,
    pitzer_virial_compressibility,
    saturation_pressure,
)
from engineeringkit.thermodynamics.utils import if97
The acentric factor of water#
From the IF97 saturation line at 0.7 times the critical temperature.
p07 = float(saturation_pressure(0.7 * if97.T_CRIT))
omega_water = pitzer_acentric_factor(p07, if97.P_CRIT)
print(f"water: p_s(0.7 Tc) = {p07 / 1e3:.1f} kPa, p_r = {p07 / if97.P_CRIT:.4f}, omega = {omega_water:.3f} (tables: 0.344)")
assert np.isclose(omega_water, 0.344, atol=0.002)
water: p_s(0.7 Tc) = 998.4 kPa, p_r = 0.0453, omega = 0.344 (tables: 0.344)
The compressibility of n-butane#
Smith, Van Ness and Abbott’s example: n-butane (Tc = 425.1 K, pc = 3.796 MPa, omega = 0.200) at 510 K and 25 bar has Z = 0.879 by the generalized virial correlation. Peng and Robinson’s cubic gives a similar value; both fall below one, as attraction between the molecules dominates.
Tc, pc, omega = 425.1, 3.796e6, 0.200
z = pitzer_virial_compressibility(510.0, 2.5e6, Tc, pc, omega)
print(f"n-butane, 510 K, 25 bar: Z = {z:.3f} (virial), {peng_robinson_compressibility(510.0, 2.5e6, Tc, pc, omega):.3f} (Peng-Robinson)")
assert abs(z - 0.879) < 1e-3
n-butane, 510 K, 25 bar: Z = 0.879 (virial), 0.858 (Peng-Robinson)
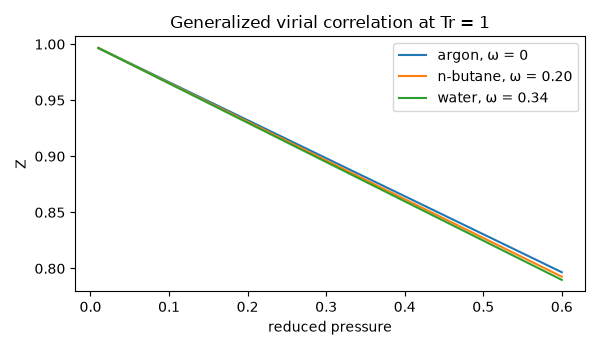
The third parameter on the chart#
On the critical isotherm, at the same reduced pressure, a fluid with larger omega deviates more from the ideal gas. (Above about 1.05 Tc the correction changes sign.)
pr_ = np.linspace(0.01, 0.6, 50)
fig, ax = plt.subplots(figsize=(6, 3.5))
for w, name in ((0.0, "argon, ω = 0"), (0.2, "n-butane, ω = 0.20"), (0.344, "water, ω = 0.34")):
    ax.plot(pr_, pitzer_virial_compressibility(Tc, pr_ * pc, Tc, pc, w), label=name)
ax.set(xlabel="reduced pressure", ylabel="Z", title="Generalized virial correlation at Tr = 1")
ax.legend()
fig.tight_layout()
assert pitzer_virial_compressibility(Tc, 0.5 * pc, Tc, pc, 0.344) < pitzer_virial_compressibility(Tc, 0.5 * pc, Tc, pc, 0.0)

plt.show()
Total running time of the script: (0 minutes 0.108 seconds)
