
Note
Go to the end to download the full example code or to run this example in your browser via JupyterLite.
Carrier’s air-conditioning processes (1911)#
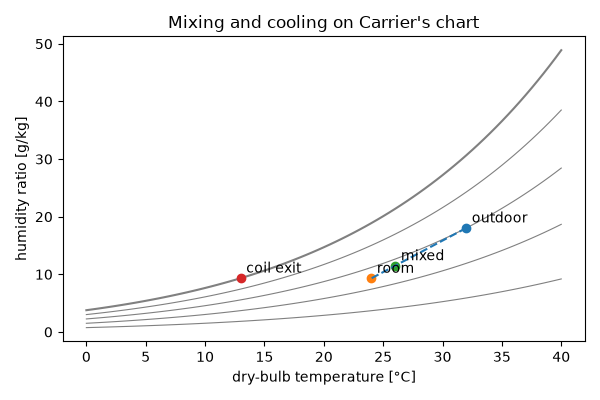
Carrier’s chart turned air conditioning into a sequence of processes drawn
as lines on it, each a balance of dry air, water and enthalpy
(moist_air_enthalpy()). Mixing two
streams lands on the straight line between them
(adiabatic_mixing()). A cooling coil
below the dew point dehumidifies
(cooling_coil()). Evaporation into air
cools it toward the adiabatic saturation temperature
(adiabatic_saturation_temperature()), as
in a cooling tower (cooling_tower()).
import matplotlib.pyplot as plt
import numpy as np

from engineeringkit.thermodynamics import (
    adiabatic_mixing,
    adiabatic_saturation_temperature,
    cooling_coil,
    cooling_tower,
    dew_point,
    humidity_ratio,
)
Summer air conditioning#
Outdoor air at 32 °C and 60% is mixed one to three with return air at 24 °C and 50%, then cooled to 13 °C.
w_out, w_room = float(humidity_ratio(305.15, 0.6)), float(humidity_ratio(297.15, 0.5))
T_mix, w_mix = adiabatic_mixing(1.0, 305.15, w_out, 3.0, 297.15, w_room)
w_coil, q, water = cooling_coil(T_mix, float(w_mix / humidity_ratio(T_mix, 1.0)), 286.15)
print(f"mixed air {T_mix - 273.15:.1f} °C, w = {w_mix * 1e3:.2f} g/kg, dew point {dew_point(w_mix) - 273.15:.1f} °C")
print(f"coil to 13 °C: removes {q / 1e3:.1f} kJ and condenses {water * 1e3:.2f} g per kg of dry air")
assert water > 0 and w_coil < w_mix < w_out
mixed air 26.0 °C, w = 11.48 g/kg, dew point 16.2 °C
coil to 13 °C: removes 18.2 kJ and condenses 1.97 g per kg of dry air
The cooling tower of a power station#
Çengel and Boles, Example 14-9: 100 kg/s of cooling water from 35 to 22 °C; air enters at 20 °C and 60% and leaves saturated at 30 °C. The book finds about 96.9 kg/s of dry air and 1.8 kg/s of make-up water.
m_air, makeup = cooling_tower(100.0, 308.15, 295.15, 293.15, 0.6, 303.15)
T_wet = adiabatic_saturation_temperature(293.15, float(humidity_ratio(293.15, 0.6)))
print(f"dry air {m_air:.1f} kg/s, make-up water {makeup:.2f} kg/s; wet-bulb limit {T_wet - 273.15:.1f} °C")
assert abs(makeup - 1.80) < 0.05 and T_wet < 295.15  # the water cannot be cooled below the wet bulb
dry air 97.6 kg/s, make-up water 1.80 kg/s; wet-bulb limit 15.1 °C
The processes on the chart#
T = np.linspace(273.15, 313.15, 81)
fig, ax = plt.subplots(figsize=(6, 4))
for phi in (0.2, 0.4, 0.6, 0.8, 1.0):
    ax.plot(T - 273.15, humidity_ratio(T, phi) * 1e3, color="gray", lw=0.8 if phi < 1 else 1.5)
points = {"outdoor": (305.15, w_out), "room": (297.15, w_room), "mixed": (T_mix, w_mix), "coil exit": (286.15, w_coil)}
for name, (Tp, wp) in points.items():
    ax.plot(Tp - 273.15, wp * 1e3, "o")
    ax.annotate(name, (Tp - 273.15, wp * 1e3), textcoords="offset points", xytext=(4, 4))
ax.plot([305.15 - 273.15, 297.15 - 273.15], [w_out * 1e3, w_room * 1e3], "C0--")
ax.set(xlabel="dry-bulb temperature [°C]", ylabel="humidity ratio [g/kg]", title="Mixing and cooling on Carrier's chart")
fig.tight_layout()

plt.show()
Total running time of the script: (0 minutes 0.070 seconds)
