
Note
Go to the end to download the full example code or to run this example in your browser via JupyterLite.
Oswald’s efficiency factor and the parabolic drag polar#
W. Bailey Oswald’s NACA Report 408 (1933) folded every source of
lift-dependent drag of a whole aeroplane into one efficiency factor, so its
drag polar becomes \(C_D = C_{D0} + C_L^2/(\pi e AR)\)
(drag_polar()). The maximum lift-to-drag
ratio lies where a line from the origin is tangent to the polar, at
\(C_L = \sqrt{\pi e AR C_{D0}}\)
(best_glide_cl()). The empirical
oswald_efficiency_estimate() supplies
\(e\) for straight wings.
import matplotlib.pyplot as plt
import numpy as np

from engineeringkit.aerodynamics import best_glide_cl, drag_polar, glide_ratio, oswald_efficiency_estimate
from engineeringkit.aerodynamics.visualizers import plot_drag_polar
Polars for three aspect ratios#
cd0 = 0.022
cl = np.linspace(-0.4, 1.6, 401)
fig, ax = plt.subplots(figsize=(6, 4.5))
for AR in [5.0, 8.0, 10.0]:
    e = float(oswald_efficiency_estimate(AR))
    plot_drag_polar(cl, drag_polar(cl, cd0, AR, e), ax=ax, label=f"AR = {AR:.0f}, e = {e:.2f}")
    cl_star = float(best_glide_cl(cd0, AR, e))
    ld_max = float(glide_ratio(cl_star, drag_polar(cl_star, cd0, AR, e)))
    print(f"AR = {AR:4.1f}: e = {e:.3f}, best-glide C_L = {cl_star:.3f}, (L/D)max = {ld_max:.2f}")
    # At the tangent point induced drag equals parasite drag.
    assert np.isclose(drag_polar(cl_star, cd0, AR, e), 2 * cd0)
    assert np.isclose(ld_max, 0.5 * np.sqrt(np.pi * e * AR / cd0))
ax.set_title("Parabolic drag polars and best-glide tangents")
fig.tight_layout()

plt.show()
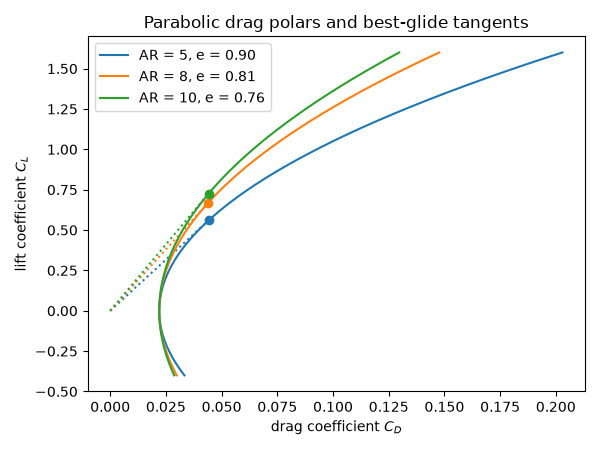
AR =  5.0: e = 0.901, best-glide C_L = 0.558, (L/D)max = 12.68
AR =  8.0: e = 0.811, best-glide C_L = 0.669, (L/D)max = 15.22
AR = 10.0: e = 0.757, best-glide C_L = 0.723, (L/D)max = 16.44
Total running time of the script: (0 minutes 0.157 seconds)
