
Note
Go to the end to download the full example code or to run this example in your browser via JupyterLite.
Bode’s gain and phase margins#
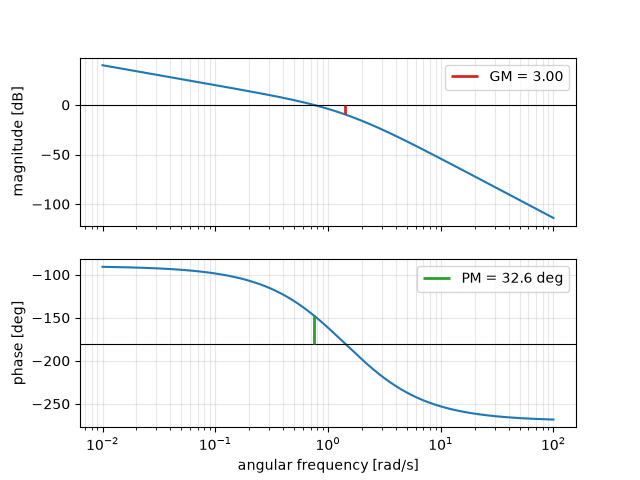
Hendrik Bode (1940, 1945) turned Nyquist’s criterion into design numbers
read off a logarithmic plot of gain and phase
(bode()). The gain margin is how
much the loop gain can grow before the phase-crossover point reaches
\(-1\); the phase margin is how much extra lag the loop tolerates at
the gain crossover (stability_margins()).
For \(L = 2/(s(s+1)(s+2))\) the phase crosses \(-180^\circ\) at
\(\omega = \sqrt2\), where \(|L| = 1/3\), so the gain margin is 3.
import matplotlib.pyplot as plt
import numpy as np
from scipy.optimize import brentq

from engineeringkit.control_systems import feedback, poles, stability_margins, transfer_function
from engineeringkit.control_systems.visualizers import plot_bode

loop = transfer_function([2], [1, 3, 2, 0])
m = stability_margins(loop)
print({k: round(v, 4) for k, v in m.items()})
{'gain_margin': 3.0, 'phase_margin_deg': 32.6131, 'gain_cross_frequency': 0.7494, 'phase_cross_frequency': 1.4142}
Independent checks#
wc = brentq(lambda w: 2 / (w * np.hypot(w, 1) * np.hypot(w, 2)) - 1, 0.1, 2)
pm = 180 - np.degrees(np.pi / 2 + np.arctan(wc) + np.arctan(wc / 2))
assert np.isclose(m["gain_margin"], 3, rtol=1e-4) and np.isclose(m["phase_cross_frequency"], np.sqrt(2), rtol=1e-4)
assert np.isclose(m["gain_cross_frequency"], wc, rtol=1e-4) and np.isclose(m["phase_margin_deg"], pm, atol=0.01)
# Multiplying the gain by the gain margin puts closed-loop poles on the axis.
edge = poles(feedback(transfer_function([2 * m["gain_margin"]], [1, 3, 2, 0])))
assert np.isclose(np.abs(edge.imag).max(), np.sqrt(2), rtol=1e-3) and abs(edge.real.max()) < 1e-3

ax_mag, ax_phase = plot_bode(loop, np.logspace(-2, 2, 500))
ax_mag.axhline(0, color="k", lw=0.8)
ax_phase.axhline(-180, color="k", lw=0.8)
ax_mag.vlines(m["phase_cross_frequency"], -20 * np.log10(m["gain_margin"]), 0, color="C3", lw=2, label=f"GM = {m['gain_margin']:.2f}")
pm_label = f"PM = {m['phase_margin_deg']:.1f} deg"
ax_phase.vlines(m["gain_cross_frequency"], -180, -180 + m["phase_margin_deg"], color="C2", lw=2, label=pm_label)
ax_mag.legend()
ax_phase.legend()

plt.show()
Total running time of the script: (0 minutes 0.211 seconds)
