
Note
Go to the end to download the full example code or to run this example in your browser via JupyterLite.
Helmholtz’s inductive current rise (1851)#
When a battery is switched onto a coil, the current does not jump to
Ohm’s value: the coil’s self-induction opposes the change. Hermann
Helmholtz measured how long induced currents last and in 1851 gave the
law of their rise, \(i = (V/R)\left(1 - e^{-Rt/L}\right)\), with the
time scale \(L/R\)
(rl_current(),
rl_time_constant()). Opening
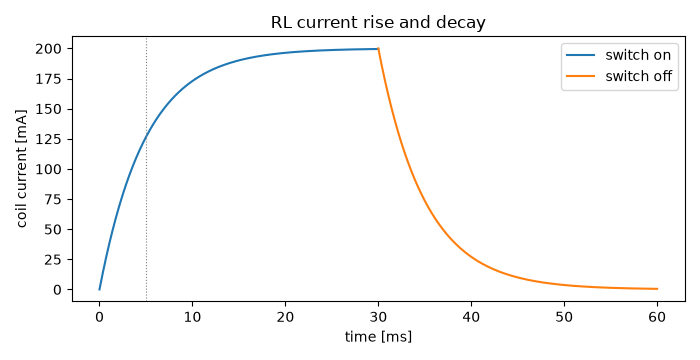
the circuit, the current decays with the same time constant. This example
switches a relay coil on and off and checks the energy bookkeeping: what
the source supplies is dissipated in the resistance or stored as
\(\tfrac12 L i^2\).
import matplotlib.pyplot as plt
import numpy as np
from scipy.integrate import trapezoid

from engineeringkit.electrical_engineering import rl_current, rl_time_constant
Switching on#
A 24 V relay coil of 120 ohm and 0.6 H.
V, R, L = 24.0, 120.0, 0.6
tau = rl_time_constant(L, R)
t = np.linspace(0, 6 * tau, 3001)
i_on = rl_current(V, R, L, t)
print(f"tau = L/R = {1e3 * tau:.1f} ms; i(tau) = {1e3 * rl_current(V, R, L, tau):.1f} mA of {1e3 * V / R:.0f} mA")
assert np.isclose(rl_current(V, R, L, tau), (V / R) * (1 - np.exp(-1)))
tau = L/R = 5.0 ms; i(tau) = 126.4 mA of 200 mA
Energy balance#
supplied = trapezoid(V * i_on, t)
dissipated = trapezoid(R * i_on**2, t)
stored = 0.5 * L * i_on[-1] ** 2
print(f"supplied {1e3 * supplied:.3f} mJ = dissipated {1e3 * dissipated:.3f} mJ + stored {1e3 * stored:.3f} mJ")
assert np.isclose(supplied, dissipated + stored, rtol=1e-6)
supplied 120.059 mJ = dissipated 108.119 mJ + stored 11.941 mJ
Switching off through a freewheeling path#
The coil current decays from its final value with the same time constant, and the stored energy ends up in the resistance.
i_off = rl_current(0.0, R, L, t, i0=V / R)
assert np.isclose(trapezoid(R * i_off**2, t), 0.5 * L * (V / R) ** 2, rtol=1e-4)

fig, ax = plt.subplots(figsize=(7, 3.6))
ax.plot(1e3 * t, 1e3 * i_on, label="switch on")
ax.plot(1e3 * (t + t[-1]), 1e3 * i_off, label="switch off")
ax.axvline(1e3 * tau, color="gray", ls=":", lw=0.8)
ax.set(xlabel="time [ms]", ylabel="coil current [mA]", title="RL current rise and decay")
ax.legend()
fig.tight_layout()

plt.show()
Total running time of the script: (0 minutes 0.072 seconds)
