
Note
Go to the end to download the full example code or to run this example in your browser via JupyterLite.
Cohen’s maximum likelihood for censored Weibull data (1965)#
A rank-regression line uses a censored unit only through the ranks of
later failures. A. Clifford Cohen (1965) wrote out the maximum-likelihood
equations of the Weibull distribution for complete, singly censored and
progressively censored samples. Every unit contributes: a failure through
its density, a survivor through \(R(t)\). The shape solves one
equation in \(\beta\) alone, and \(\eta\) follows
(weibull_mle()). The example repeats a
heavily censored test many times and compares the scatter of the two
estimators.
import matplotlib.pyplot as plt
import numpy as np

from engineeringkit.reliability import weibull_mle, weibull_rank_regression
One test, stopped at 600 h#
Twenty units with \(\eta\) = 1000 h, \(\beta\) = 1.8; the test ends at 600 h with the survivors still running (Type I censoring).
eta, beta, n, stop = 1000.0, 1.8, 20, 600.0
rng = np.random.default_rng(7)


def run_test():
    life = eta * rng.weibull(beta, n)
    return np.minimum(life, stop), (life <= stop).astype(int)


times, failed = run_test()
mle, rr = weibull_mle(times, failed), weibull_rank_regression(times, failed)
print(f"{failed.sum()} of {n} failed by {stop:.0f} h")
print(f"maximum likelihood: beta = {mle.beta:.2f}, eta = {mle.eta:.0f} h")
print(f"rank regression:    beta = {rr.beta:.2f}, eta = {rr.eta:.0f} h")
6 of 20 failed by 600 h
maximum likelihood: beta = 2.07, eta = 1001 h
rank regression:    beta = 0.97, eta = 2742 h
Scatter over 2000 repeated tests#
estimates = {"maximum likelihood": [], "rank regression": []}
while len(estimates["rank regression"]) < 2000:
    times, failed = run_test()
    if failed.sum() >= 3:
        estimates["maximum likelihood"].append(weibull_mle(times, failed).beta)
        estimates["rank regression"].append(weibull_rank_regression(times, failed).beta)
fig, ax = plt.subplots(figsize=(6, 3.8))
for label, values in estimates.items():
    values = np.array(values)
    rmse = np.sqrt(np.mean((values - beta) ** 2))
    print(f"{label:18s}: median beta {np.median(values):.2f}, RMS error {rmse:.2f}")
    ax.hist(values, bins=np.linspace(0, 5, 60), histtype="step", label=f"{label} (RMS error {rmse:.2f})")
ax.axvline(beta, color="k", ls=":")
ax.set(xlabel=r"estimated $\beta$", ylabel="tests", title="20 units, test stopped at 600 h")
ax.legend()
fig.tight_layout()

mle_error = np.sqrt(np.mean((np.array(estimates["maximum likelihood"]) - beta) ** 2))
rr_error = np.sqrt(np.mean((np.array(estimates["rank regression"]) - beta) ** 2))
assert abs(np.median(estimates["maximum likelihood"]) - beta) < 0.2
assert mle_error < rr_error

plt.show()
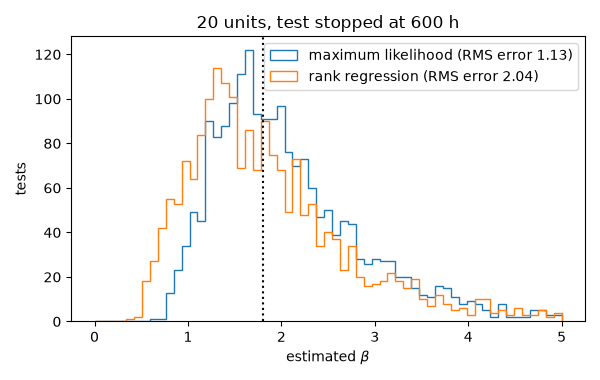
maximum likelihood: median beta 1.91, RMS error 1.13
rank regression   : median beta 1.70, RMS error 2.04
Total running time of the script: (0 minutes 0.729 seconds)
