
Note
Go to the end to download the full example code or to run this example in your browser via JupyterLite.
Hilbert’s conjugate functions and the analytic signal (1905)#
In his third communication on integral equations (1905), David Hilbert
paired a function on the unit circle with its conjugate, the boundary
values of the real and imaginary parts of one analytic function, through
the singular kernel \(\cot\frac{s - t}{2}\). In frequency terms the
pairing shifts every component by -90°: \(\cos \to \sin\). Dennis
Gabor (1946) added the conjugate to a real signal as its imaginary part,
\(z = x + j\mathcal{H}x\), and called the result the analytic signal:
it has no negative frequencies, its magnitude is the envelope and its
phase advances at the instantaneous frequency
(hilbert_transform(),
analytic_signal(),
envelope(),
instantaneous_frequency(),
hilbert_fir()). The 1905 date and
pages come from the Göttingen Nachrichten catalogue record; that the
transform pair appears there follows F. W. King, Hilbert Transforms
(Cambridge, 2009), a secondary source.
import matplotlib.pyplot as plt
import numpy as np

from engineeringkit.signal_processing import (
    analytic_signal,
    db20,
    envelope,
    filter_signal,
    frequency_response,
    hilbert_fir,
    hilbert_transform,
    instantaneous_frequency,
)
A -90° shift for every frequency#
fs = 1000.0
t = np.arange(1000) / fs
x = np.cos(2 * np.pi * 30 * t) + 0.5 * np.cos(2 * np.pi * 70 * t + 1.0)
expected = np.sin(2 * np.pi * 30 * t) + 0.5 * np.sin(2 * np.pi * 70 * t + 1.0)
assert np.allclose(hilbert_transform(x), expected)
Z = np.fft.fft(analytic_signal(x))
print(f"negative-frequency energy fraction: {np.sum(np.abs(Z[501:]) ** 2) / np.sum(np.abs(Z) ** 2):.1e}")
negative-frequency energy fraction: 3.9e-32
Envelope and instantaneous frequency#
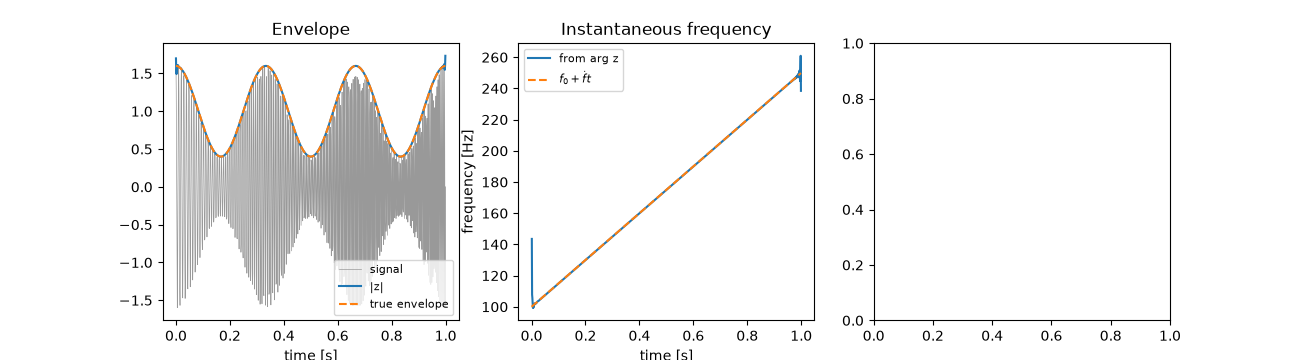
An amplitude-modulated chirp: the envelope is recovered without a rectifier and low-pass filter, and the phase slope gives the sweep.
f0, rate = 100.0, 150.0
a = 1 + 0.6 * np.cos(2 * np.pi * 3 * t)
chirp = a * np.cos(2 * np.pi * (f0 * t + rate * t**2 / 2))
env = envelope(chirp)
f_inst = instantaneous_frequency(chirp, fs)
inner = slice(100, -100)
fig, axes = plt.subplots(1, 3, figsize=(13, 3.6))
axes[0].plot(t, chirp, lw=0.5, color="0.6", label="signal")
axes[0].plot(t, env, label="|z|")
axes[0].plot(t, a, "--", label="true envelope")
axes[0].set(xlabel="time [s]", title="Envelope")
axes[0].legend(fontsize=8)
axes[1].plot(t[1:], f_inst, label="from arg z")
axes[1].plot(t, f0 + rate * t, "--", label="$f_0 + \\dot f t$")
axes[1].set(xlabel="time [s]", ylabel="frequency [Hz]", title="Instantaneous frequency")
axes[1].legend(fontsize=8)
envelope_error = np.abs(env - a)[inner].max()
frequency_error = np.abs(f_inst - (f0 + rate * (t[1:] - 0.5 / fs)))[inner].max()
print(f"envelope error {envelope_error:.3f}, frequency error {frequency_error:.2f} Hz")
envelope error 0.000, frequency error 0.03 Hz
A causal FIR Hilbert transformer#
The ideal impulse response \(2/(\pi m)\) for odd \(m\) is windowed to 61 taps. Its gain is close to one away from DC and Nyquist, and its output, paired with the input delayed by 30 samples, matches the FFT-based transform.
h = hilbert_fir(61)
f, H = frequency_response(h, 1, worN=2048, fs=fs)
axes[2].plot(f, db20(np.maximum(np.abs(H), 1e-6)))
axes[2].set(xlabel="frequency [Hz]", ylabel="gain [dB]", ylim=(-20, 2), title="61-tap Hilbert FIR")
fig.tight_layout()
y = filter_signal(h, 1, x)
fir_error = np.abs(y[60:] - hilbert_transform(x)[30:-30]).max()
print(f"FIR against FFT transform: largest difference {fir_error:.3f}")
assert envelope_error < 0.02 and frequency_error < 1.0
assert fir_error < 0.02

plt.show()
FIR against FFT transform: largest difference 0.003
Total running time of the script: (0 minutes 0.249 seconds)
