
Note
Go to the end to download the full example code or to run this example in your browser via JupyterLite.
Stockham’s high-speed convolution (1966)#
The FFT multiplies spectra cheaply, but the product of two DFTs is the
circular convolution: the tail of the output wraps round onto its start.
Thomas Stockham, at MIT’s Project MAC, showed at the 1966 Spring Joint
Computer Conference how to get the linear convolution anyway, and fast:
zero-pad both sequences to at least \(N_x + N_h - 1\) samples, and,
for a long record, cut it into blocks, convolve each through the FFT and
add the overlapping tails, overlap-add
(circular_convolution(),
overlap_add()). Zero padding does
not add resolution to a spectrum; it only samples the same spectrum more
finely, which is the last section here.
import matplotlib.pyplot as plt
import numpy as np

from engineeringkit.signal_processing import circular_convolution, convolution, overlap_add, windowed_spectrum
Circular against linear convolution#
With \(N = 8\) the last three samples of the 11-sample linear result wrap onto the first three. Padding to \(N = 11\) removes the wrap.
x = np.array([1.0, 2.0, 3.0, 4.0, 3.0, 2.0, 1.0, 0.0])
h = np.array([1.0, -1.0, 0.5, 0.25])
linear = convolution(x, h)
wrapped = circular_convolution(x, h)
padded = circular_convolution(x, h, n=x.size + h.size - 1)
assert np.allclose(np.fft.ifft(np.fft.fft(x) * np.fft.fft(h, 8)).real, wrapped)
aliased = linear[:8].copy()
aliased[:3] += linear[8:]
assert np.allclose(wrapped, aliased) and np.allclose(padded, linear)
fig, axes = plt.subplots(1, 3, figsize=(13, 3.6))
axes[0].stem(linear, basefmt=" ", label="linear (11)")
axes[0].plot(wrapped, "rs", mfc="none", label="circular, N = 8")
axes[0].set(xlabel="n", title="Time aliasing")
axes[0].legend(fontsize=8)
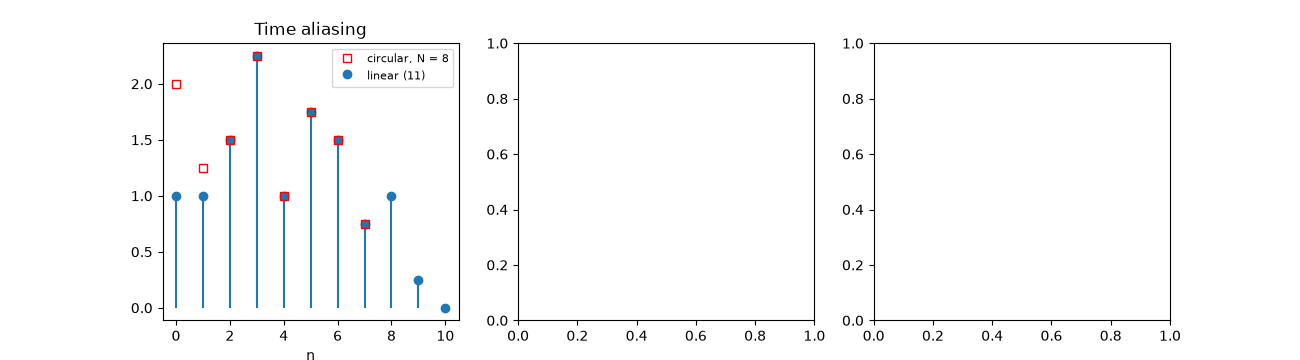
<matplotlib.legend.Legend object at 0x7fd5b6721340>
Overlap-add on a long record#
A 255-tap filter on a million samples, in blocks of 770 samples padded to 1024. The blocks match direct convolution to rounding error. Direct convolution costs \(M\) multiplications per output sample; overlap-add costs about two FFTs of \(N_{FFT}\) points per block of \(L\) outputs, which wins once the filter has a few dozen taps. (Timing it here would compare NumPy’s compiled loop with a Python loop over blocks, so the count is the fair comparison.)
rng = np.random.default_rng(1966)
record, taps = rng.normal(size=1_000_000), rng.normal(size=255)
direct = convolution(record, taps)
fast = overlap_add(record, taps)
error = np.abs(fast - direct).max() / np.abs(direct).max()
print(f"relative difference from direct convolution: {error:.1e}")
lengths = np.array([4, 16, 64, 255, 1024])
n_ffts = np.array([1 << int(np.ceil(np.log2(4 * m))) for m in lengths])
ops_fast = 2 * n_ffts * np.log2(n_ffts) / (n_ffts - lengths + 1)
for m, ops in zip(lengths, ops_fast):
    print(f"M = {m:4d}: direct {m:4d}, overlap-add {ops:5.1f} multiplications per output")
axes[1].loglog(lengths, lengths, "o-", label="direct: M per output")
axes[1].loglog(lengths, ops_fast, "s-", label="overlap-add: 2 N log2 N / L")
axes[1].set(xlabel="filter length M", ylabel="multiplications per output", title="Cost")
axes[1].legend(fontsize=8)
relative difference from direct convolution: 5.1e-16
M =    4: direct    4, overlap-add   9.8 multiplications per output
M =   16: direct   16, overlap-add  15.7 multiplications per output
M =   64: direct   64, overlap-add  21.2 multiplications per output
M =  255: direct  255, overlap-add  26.6 multiplications per output
M = 1024: direct 1024, overlap-add  32.0 multiplications per output

<matplotlib.legend.Legend object at 0x7fd5b632ef00>
Zero padding interpolates, it does not resolve#
Two tones 2 Hz apart in a one-second record are 2 bins apart and resolved. In a quarter-second record they are half a bin apart, and padding that record to 4096 points draws a smoother curve of the same single blurred peak.
fs = 256.0
for duration, n_fft, style in ((1.0, None, "-"), (0.25, 4096, "--")):
    t = np.arange(int(duration * fs)) / fs
    tones = np.sin(2 * np.pi * 40 * t) + np.sin(2 * np.pi * 42 * t)
    f, magnitude = windowed_spectrum(tones, fs, window="hann", n_fft=n_fft)
    axes[2].plot(f, magnitude / magnitude.max(), style, label=f"{duration} s" + (f", padded to {n_fft}" if n_fft else ""))
    band = (f > 38) & (f < 44)
    peaks = np.count_nonzero((magnitude[1:-1] > magnitude[:-2]) & (magnitude[1:-1] > magnitude[2:]) & band[1:-1])
    print(f"{duration} s record: {peaks} peak(s) between 38 and 44 Hz")
    if n_fft:
        assert peaks == 1
    else:
        assert peaks == 2
axes[2].set(xlim=(30, 55), xlabel="frequency [Hz]", ylabel="normalized magnitude", title="Zero padding")
axes[2].legend(fontsize=8)
fig.tight_layout()
assert error < 1e-12
assert ops_fast[-1] < lengths[-1] / 10

plt.show()
1.0 s record: 2 peak(s) between 38 and 44 Hz
0.25 s record: 1 peak(s) between 38 and 44 Hz
Total running time of the script: (0 minutes 0.369 seconds)
