
Note
Go to the end to download the full example code or to run this example in your browser via JupyterLite.
Dittus and Boelter: turbulent pipe convection (1930)#
At Berkeley in 1930 Frank Dittus and Llewellyn Boelter correlated tests on
automobile radiator tubes with a power law in the Reynolds and Prandtl
numbers. In McAdams’s rounded form,
\(Nu = 0.023\,Re^{0.8}Pr^{n}\) with \(n = 0.4\) for heating and
0.3 for cooling (dittus_boelter_nusselt()),
it became the most quoted equation in convection. This example sizes the
coefficient for water in a tube, shows that the Colburn analogy between
friction and heat transfer reproduces the 0.023, and measures the scatter
against Gnielinski’s modern correlation.
import matplotlib.pyplot as plt
import numpy as np

from engineeringkit.heat_transfer import dittus_boelter_nusselt
Water in a radiator tube#
Water at about 300 K (\(\nu = 8.57\times10^{-7}\) m²/s, \(k = 0.613\) W/(m K), \(Pr = 5.83\)) flows at 1 m/s in a 20 mm tube.
V, D, nu, k, Pr = 1.0, 0.02, 8.57e-7, 0.613, 5.83
Re = V * D / nu
h_heat = dittus_boelter_nusselt(Re, Pr) * k / D
h_cool = dittus_boelter_nusselt(Re, Pr, heating=False) * k / D
print(f"Re = {Re:.0f}: h = {h_heat:.0f} W/(m² K) heating, {h_cool:.0f} W/(m² K) cooling")
Re = 23337: h = 4455 W/(m² K) heating, 3735 W/(m² K) cooling
The Colburn analogy#
Colburn (1933) argued that momentum and heat diffuse alike in turbulent flow, \(St\,Pr^{2/3} = f/8\). With the smooth-pipe friction factor \(f = 0.184\,Re^{-0.2}\) this gives \(Nu = (f/8)\,Re\,Pr^{1/3} = 0.023\,Re^{0.8}Pr^{1/3}\), the Dittus-Boelter form with the exponent 1/3; at \(Pr = 1\) the two are identical.
Re_range = np.geomspace(1e4, 1e6, 60)
f = 0.184 * Re_range**-0.2
colburn = f / 8 * Re_range
assert np.allclose(colburn, dittus_boelter_nusselt(Re_range, 1.0))
print("Colburn's analogy at Pr = 1 reproduces 0.023 Re^0.8 exactly")
Colburn's analogy at Pr = 1 reproduces 0.023 Re^0.8 exactly
Against Gnielinski (1976)#
Gnielinski’s correlation, built on Petukhov’s friction factor, fits modern data to about 10%. Dittus-Boelter stays within 30% of it from air to water.
fig, ax = plt.subplots(figsize=(6, 4))
for Pr_i in [0.7, 7.0]:
    f = (0.790 * np.log(Re_range) - 1.64) ** -2
    gnielinski = (f / 8) * (Re_range - 1000) * Pr_i / (1 + 12.7 * np.sqrt(f / 8) * (Pr_i ** (2 / 3) - 1))
    db = dittus_boelter_nusselt(Re_range, Pr_i)
    spread = np.max(np.abs(db / gnielinski - 1))
    print(f"Pr = {Pr_i}: largest difference from Gnielinski {spread:.0%}")
    assert spread < 0.30
    line = ax.loglog(Re_range, db, label=f"Dittus-Boelter, Pr = {Pr_i}")[0]
    ax.loglog(Re_range, gnielinski, "--", color=line.get_color(), label=f"Gnielinski, Pr = {Pr_i}")
ax.set(xlabel="Reynolds number", ylabel="Nusselt number", title="Turbulent flow in a smooth tube")
ax.legend()
fig.tight_layout()

plt.show()
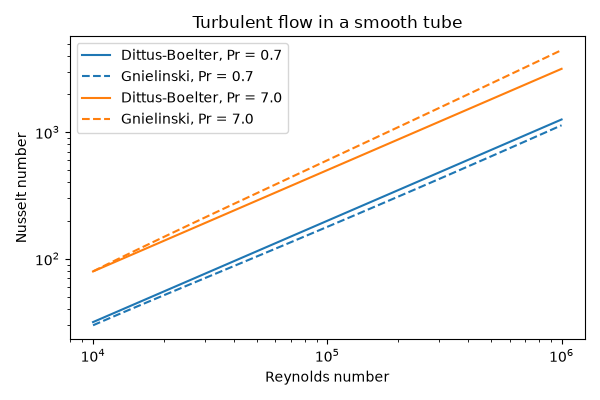
Pr = 0.7: largest difference from Gnielinski 13%
Pr = 7.0: largest difference from Gnielinski 29%
Total running time of the script: (0 minutes 0.052 seconds)
