Note
Go to the end to download the full example code or to run this example in your browser via JupyterLite.
Poisson’s adiabat (1823)#
Siméon Denis Poisson showed that a gas compressed or expanded without
exchanging heat follows T p^(-R/c_p) = constant. Combined with
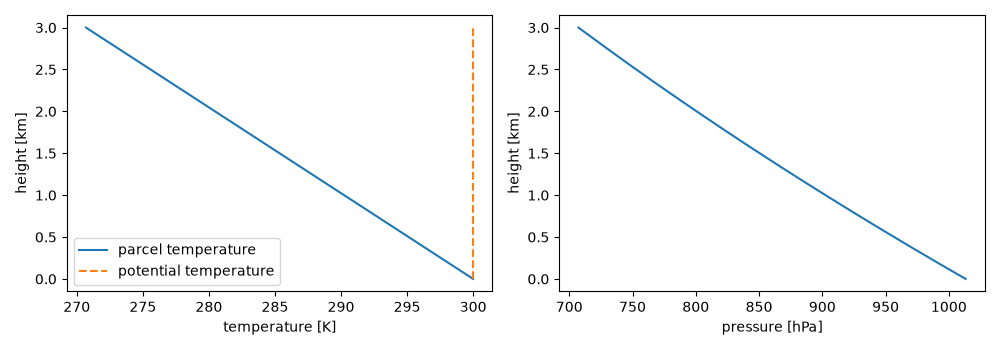
hydrostatic balance, a rising dry parcel cools at the dry adiabatic lapse
rate g / c_p, close to 10 K per kilometre. Integrating the parcel’s
temperature and pressure confirms both: the cooling is linear in height and
the Poisson invariant, the potential temperature, does not change.
dry adiabatic lapse rate: 9.77 K/km
import matplotlib.pyplot as plt
import numpy as np

from earthsciencekit.atmosphere import dry_adiabatic_lapse_rate, potential_temperature, simulate_dry_ascent
from earthsciencekit.constants import CP_DRY_AIR, GRAVITY

time = np.linspace(0, 3000, 201)
result = simulate_dry_ascent(300, 101325, 1, time)
T, pressure = result.values.T
theta = potential_temperature(T, pressure, 101325)
np.testing.assert_allclose(theta, 300, rtol=3e-8)
np.testing.assert_allclose(T, 300 - dry_adiabatic_lapse_rate(GRAVITY, CP_DRY_AIR) * time, atol=1e-8)
print(f"dry adiabatic lapse rate: {dry_adiabatic_lapse_rate(GRAVITY, CP_DRY_AIR) * 1000:.2f} K/km")

fig, axes = plt.subplots(1, 2, figsize=(10, 3.5))
axes[0].plot(T, time / 1000, label="parcel temperature")
axes[0].plot(theta, time / 1000, linestyle="--", label="potential temperature")
axes[0].set(xlabel="temperature [K]", ylabel="height [km]")
axes[0].legend()
axes[1].plot(pressure / 100, time / 1000)
axes[1].set(xlabel="pressure [hPa]", ylabel="height [km]")
fig.tight_layout()

plt.show()
Total running time of the script: (0 minutes 0.169 seconds)
