Note
Go to the end to download the full example code or to run this example in your browser via JupyterLite.
Gutenberg’s core shadow (1914)#
Beno Gutenberg placed the core-mantle boundary at a depth of about 2900 km. A slower core bends rays towards the centre, so in the real Earth direct P waves fade near 103 degrees from the source and refracted core waves return only beyond about 143 degrees. In between is a shadow. The ray parameter, which is conserved along a ray, connects the two. This toy Earth has a uniform 13 km/s mantle over an 8 km/s core, so its rays are straight within each shell and its shadow starts later, at about 114 degrees.
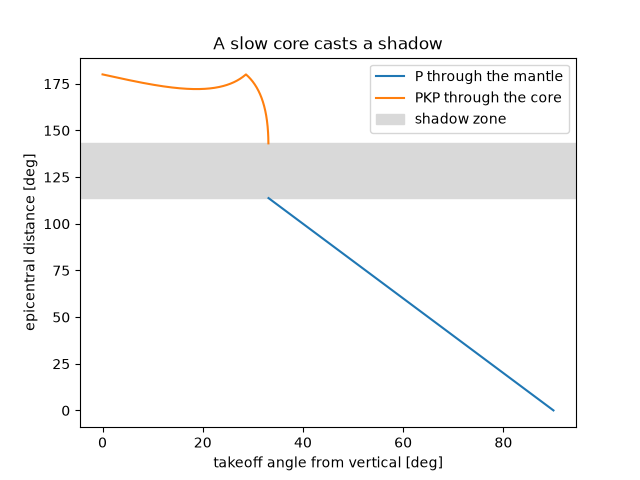
shadow zone from 113.7 to 143.1 degrees
import matplotlib.pyplot as plt
import numpy as np

from earthsciencekit.seismology import ray_parameter

R, rc = 6371e3, 3480e3
vm, vc = 13e3, 8e3
takeoff = np.linspace(1e-4, np.pi / 2 - 1e-4, 4000)
p = ray_parameter(R, vm, takeoff)
direct = p * vm >= rc
distance = np.empty_like(p)
# Center angle of a straight chord between radii r1 > r2 with r sin(i) = b is arccos(b/r1) - arccos(b/r2).
distance[direct] = 2 * np.arccos(p[direct] * vm / R)
core = ~direct
at_cmb = np.arcsin(p[core] * vm / rc)
in_core = np.arcsin(p[core] * vc / rc)
assert np.allclose(ray_parameter(rc, vm, at_cmb), ray_parameter(rc, vc, in_core))
swept = 2 * (np.arccos(p[core] * vm / R) - np.arccos(p[core] * vm / rc)) + np.pi - 2 * in_core
distance[core] = np.where(swept > np.pi, 2 * np.pi - swept, swept)

edge, far = np.degrees(distance[direct].max()), np.degrees(distance[core].min())
assert 110 < edge < 120 and 140 < far < 146
print(f"shadow zone from {edge:.1f} to {far:.1f} degrees")

fig, ax = plt.subplots()
ax.plot(np.degrees(takeoff[direct]), np.degrees(distance[direct]), label="P through the mantle")
ax.plot(np.degrees(takeoff[core]), np.degrees(distance[core]), label="PKP through the core")
ax.axhspan(edge, far, color="0.85", label="shadow zone")
ax.set(xlabel="takeoff angle from vertical [deg]", ylabel="epicentral distance [deg]", title="A slow core casts a shadow")
ax.legend()

plt.show()
Total running time of the script: (0 minutes 0.087 seconds)
