Note
Go to the end to download the full example code or to run this example in your browser via JupyterLite.
Cooper and Jacob’s straight-line method (1946)#
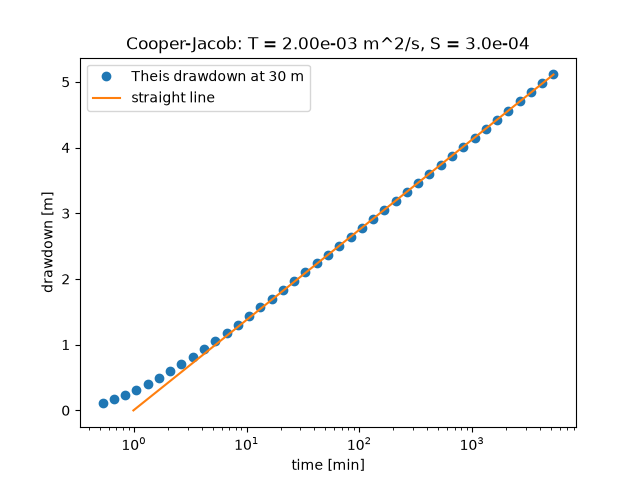
Hilton Cooper and Charles Jacob noticed that once u is small the Theis
well function is just -0.5772 - ln u, so late drawdowns fall on a straight
line against the logarithm of time. The drawdown gained per tenfold increase
in time gives the transmissivity, and the time at which the line crosses zero
drawdown gives the storativity, without matching a type curve. The example
recovers both from a synthetic pumping test.
import matplotlib.pyplot as plt
import numpy as np

from earthsciencekit.hydrology import cooper_jacob_drawdown, cooper_jacob_transmissivity, theis_drawdown

rate, transmissivity, storativity, radius = 0.015, 2e-3, 3e-4, 30.0
time = np.logspace(1.5, 5.5, 41)
observed = theis_drawdown(rate, transmissivity, storativity, radius, time)
late = radius**2 * storativity / (4 * transmissivity * time) < 0.01
slope, intercept = np.polyfit(np.log10(time[late]), observed[late], 1)
fitted_transmissivity = cooper_jacob_transmissivity(rate, slope)
zero_time = 10 ** (-intercept / slope)
fitted_storativity = 2.25 * fitted_transmissivity * zero_time / radius**2
assert np.isclose(fitted_transmissivity, transmissivity, rtol=0.01) and np.isclose(fitted_storativity, storativity, rtol=0.03)

fig, ax = plt.subplots()
ax.semilogx(time / 60, observed, "o", label="Theis drawdown at 30 m")
line_time = np.logspace(np.log10(zero_time), 5.5, 50)
ax.semilogx(
    line_time / 60, cooper_jacob_drawdown(rate, fitted_transmissivity, fitted_storativity, radius, line_time), label="straight line"
)
ax.set(xlabel="time [min]", ylabel="drawdown [m]")
ax.set_title(f"Cooper-Jacob: T = {fitted_transmissivity:.2e} m^2/s, S = {fitted_storativity:.1e}")
ax.legend()

plt.show()
Total running time of the script: (0 minutes 0.125 seconds)
