Note
Go to the end to download the full example code or to run this example in your browser via JupyterLite.
Walcott’s lithospheric flexure under loads (1970)#
Richard Walcott measured how the lithosphere bends under volcanic islands,
ice sheets and sediment, and estimated its rigidity from the bending. A line
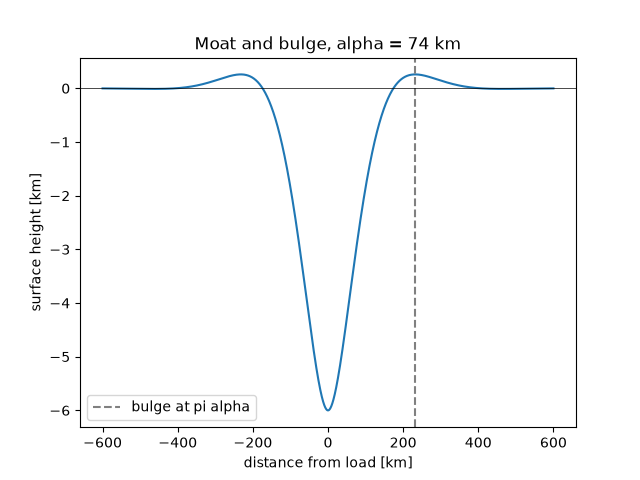
load on an elastic plate digs a moat that crosses zero at 3 pi alpha / 4
and lifts a bulge at pi alpha whose height is exp(-pi) of the central
deflection. The load here is a synthetic Hawaiian-scale ridge.
import matplotlib.pyplot as plt
import numpy as np

from earthsciencekit.constants import GRAVITY
from earthsciencekit.plate_tectonics import flexural_deflection, flexural_parameter, flexural_rigidity

rigidity = flexural_rigidity(7e10, 30e3, 0.25)
contrast, load = 3300 - 1000, 2e13
alpha = float(flexural_parameter(rigidity, contrast, GRAVITY))
x = np.linspace(-600e3, 600e3, 2401)
w = flexural_deflection(x, load, rigidity, contrast, GRAVITY)
w0 = float(flexural_deflection(0, load, rigidity, contrast, GRAVITY))
assert abs(float(flexural_deflection(3 * np.pi * alpha / 4, load, rigidity, contrast, GRAVITY))) < 1e-9 * w0
assert np.isclose(float(flexural_deflection(np.pi * alpha, load, rigidity, contrast, GRAVITY)), -np.exp(-np.pi) * w0)

fig, ax = plt.subplots()
ax.plot(x / 1e3, -w / 1e3)
ax.axvline(np.pi * alpha / 1e3, color="0.5", ls="--", label="bulge at pi alpha")
ax.axhline(0, color="k", lw=0.5)
ax.set(xlabel="distance from load [km]", ylabel="surface height [km]", title=f"Moat and bulge, alpha = {alpha / 1e3:.0f} km")
ax.legend()

plt.show()
Total running time of the script: (0 minutes 0.079 seconds)
