Note
Go to the end to download the full example code or to run this example in your browser via JupyterLite.
Glen’s flow law (1955)#
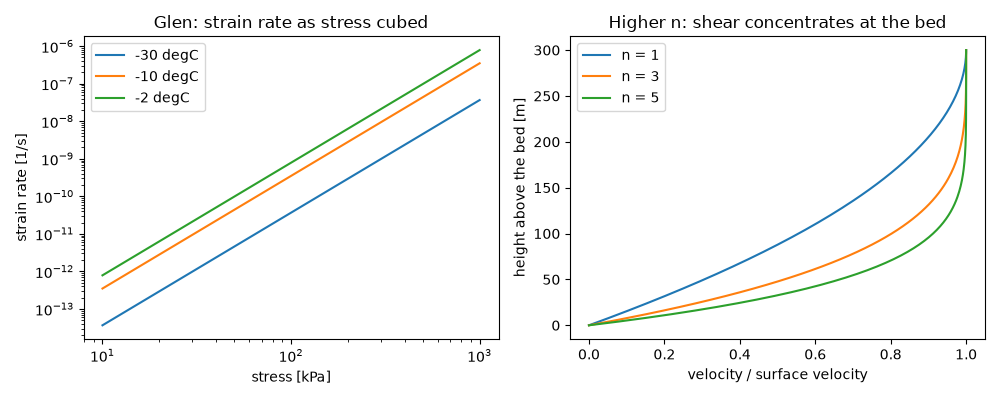
John Glen loaded cylinders of polycrystalline ice in compression at constant stress and temperature and measured their steady creep. The strain rate rose as about the cube of the stress, with a rate factor that grows steeply towards the melting point. A Glen glacier therefore shears mostly near its bed and moves almost as a block above it.
import matplotlib.pyplot as plt
import numpy as np

from earthsciencekit.constants import GRAVITY, ICE_DENSITY
from earthsciencekit.glaciology import glen_rate_factor, glen_strain_rate, glen_velocity_profile

stress = np.logspace(4, 6, 50)
fig, (left, right) = plt.subplots(1, 2, figsize=(10, 4))
for celsius in (-30, -10, -2):
    factor = glen_rate_factor(273.15 + celsius, 3.5e-25, 6e4, 263.15)
    rate = glen_strain_rate(stress, factor, 3)
    assert np.isclose(np.polyfit(np.log(stress), np.log(rate), 1)[0], 3)
    left.loglog(stress / 1e3, rate, label=f"{celsius} degC")
left.set(xlabel="stress [kPa]", ylabel="strain rate [1/s]", title="Glen: strain rate as stress cubed")
left.legend()
height = np.linspace(0, 300, 151)
for n in (1, 3, 5):
    velocity = glen_velocity_profile(height, 300, 0.05, 2.4e-24 * (1e5) ** (3 - n), n, ICE_DENSITY, GRAVITY)
    right.plot(velocity / velocity[-1], height, label=f"n = {n}")
right.set(xlabel="velocity / surface velocity", ylabel="height above the bed [m]", title="Higher n: shear concentrates at the bed")
right.legend()
fig.tight_layout()

plt.show()
Total running time of the script: (0 minutes 0.452 seconds)
