Note
Go to the end to download the full example code or to run this example in your browser via JupyterLite.
Wilson, Sparks, Huang and Watkins’s eruption columns (1978)#
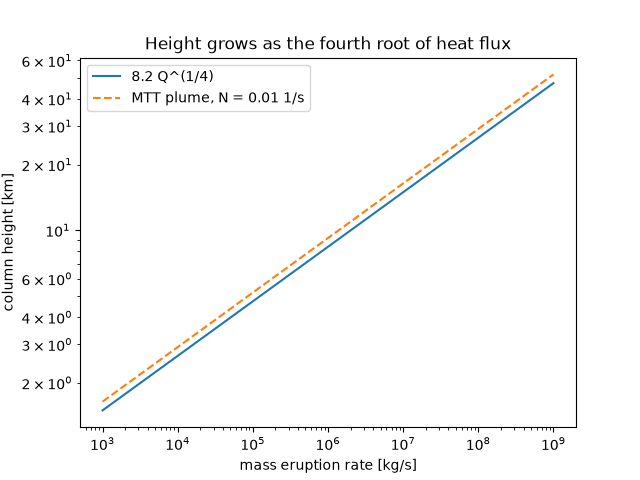
Wilson, Sparks, Huang and Watkins treated a Plinian eruption column as a
buoyant plume driven by the heat of its fragmented magma. Its height grows as
the fourth root of the heat flux, about 8.2 Q**(1/4) metres, so a column
ten times higher needs ten thousand times the eruption rate. The same height
follows from the Morton-Taylor-Turner plume with the buoyancy flux of that
heat in the atmosphere.
import matplotlib.pyplot as plt
import numpy as np

from earthsciencekit.constants import CP_DRY_AIR, GRAVITY
from earthsciencekit.volcanology import column_height, plume_rise_height

rate = np.logspace(3, 9, 61)  # kg/s of magma
heat = rate * 1100 * 1000  # specific heat 1100 J/(kg K), cooled by 1000 K
height = column_height(heat)
buoyancy_flux = GRAVITY * heat / (1.1 * CP_DRY_AIR * 270) / np.pi  # air 1.1 kg/m^3 at 270 K
plume = plume_rise_height(buoyancy_flux, 0.01)
assert np.allclose(height / plume, height[0] / plume[0]) and abs(height[0] / plume[0] - 1) < 0.15
assert np.isclose(column_height(1e12), 8200)

fig, ax = plt.subplots()
ax.loglog(rate, height / 1e3, label="8.2 Q^(1/4)")
ax.loglog(rate, plume / 1e3, "--", label="MTT plume, N = 0.01 1/s")
ax.set(xlabel="mass eruption rate [kg/s]", ylabel="column height [km]", title="Height grows as the fourth root of heat flux")
ax.legend()

plt.show()
Total running time of the script: (0 minutes 0.223 seconds)
