Note
Go to the end to download the full example code or to run this example in your browser via JupyterLite.
Milanković’s orbital insolation (1920)#
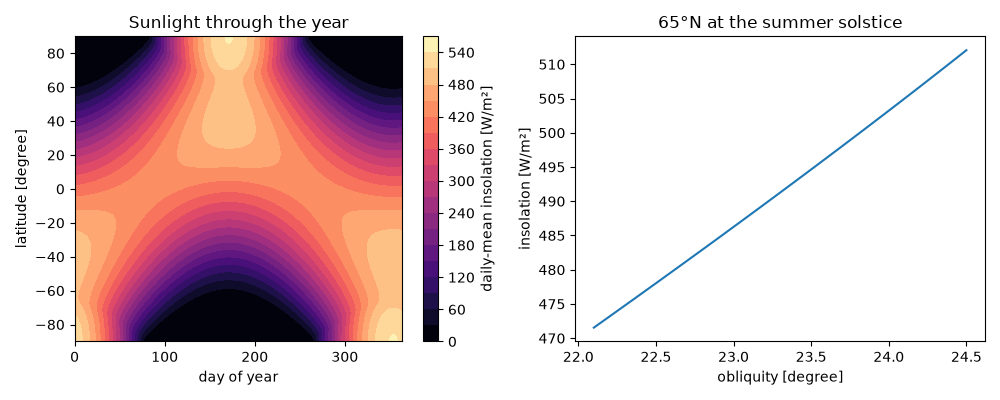
Milutin Milanković computed the sunlight each latitude receives through the year and how it changes as the tilt and orbit of the Earth vary. He proposed that ice ages begin when high northern summers receive little sunlight. The daily mean at the top of the atmosphere depends on latitude, the Sun’s declination and the Earth-Sun distance. Whatever the season, the global mean is a quarter of the solar constant.
import matplotlib.pyplot as plt
import numpy as np

from earthsciencekit.climate import daily_insolation

obliquity = np.deg2rad(23.44)
day = np.arange(365)
declination = np.arcsin(np.sin(obliquity) * np.sin(2 * np.pi * (day - 80) / 365.25))
latitude = np.deg2rad(np.linspace(-90, 90, 181))
flux = daily_insolation(1361, latitude[:, None], declination[None, :], 1)
global_mean = np.trapezoid(flux * np.cos(latitude)[:, None], latitude, axis=0) / 2
np.testing.assert_allclose(global_mean, 1361 / 4, rtol=1e-3)
assert np.isclose(daily_insolation(1361, np.pi / 2, obliquity, 1), 1361 * np.sin(obliquity))

tilt = np.deg2rad(np.linspace(22.1, 24.5, 50))
summer_65n = daily_insolation(1361, np.deg2rad(65), tilt, 1)
assert np.all(np.diff(summer_65n) > 0)

fig, (left, right) = plt.subplots(1, 2, figsize=(10, 4))
image = left.contourf(day, np.rad2deg(latitude), flux, levels=20, cmap="magma")
fig.colorbar(image, ax=left, label="daily-mean insolation [W/m²]")
left.set(xlabel="day of year", ylabel="latitude [degree]", title="Sunlight through the year")
right.plot(np.rad2deg(tilt), summer_65n)
right.set(xlabel="obliquity [degree]", ylabel="insolation [W/m²]", title="65°N at the summer solstice")
fig.tight_layout()

plt.show()
Total running time of the script: (0 minutes 0.264 seconds)
