Note
Go to the end to download the full example code or to run this example in your browser via JupyterLite.
The Challenger soundings (1872)#
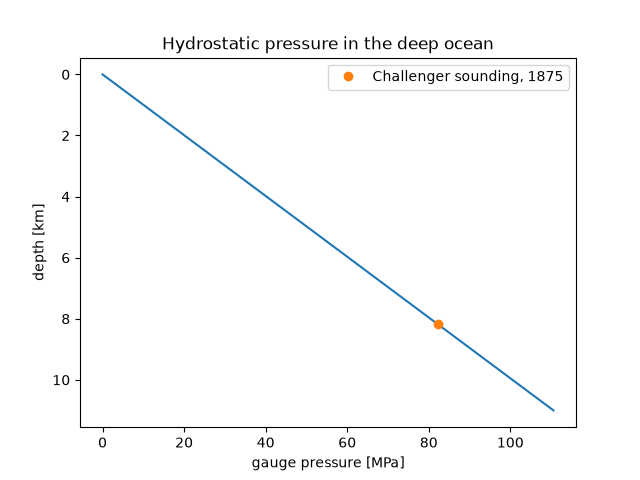
HMS Challenger’s expedition of 1872-1876 made the first systematic soundings of the deep ocean and in 1875 found 4475 fathoms (8184 m) in the Mariana Trench. Pressure in the water grows by about one atmosphere every 10 m, so the instruments at that depth had to survive more than 800 atmospheres.
import matplotlib.pyplot as plt
import numpy as np

from earthsciencekit.constants import GRAVITY
from earthsciencekit.oceanography import hydrostatic_pressure
from earthsciencekit.units import convert

atmosphere = 101325.0
deepest = 4475 * 1.8288
assert np.isclose(hydrostatic_pressure(1025, 10, GRAVITY), atmosphere, rtol=0.01)
assert hydrostatic_pressure(1025, deepest, GRAVITY) > 800 * atmosphere

depth = np.linspace(0, 11000, 200)
fig, ax = plt.subplots()
ax.plot(convert(hydrostatic_pressure(1025, depth, GRAVITY), "Pa", "MPa"), depth / 1e3)
ax.plot(convert(hydrostatic_pressure(1025, deepest, GRAVITY), "Pa", "MPa"), deepest / 1e3, "o", label="Challenger sounding, 1875")
ax.invert_yaxis()
ax.set(xlabel="gauge pressure [MPa]", ylabel="depth [km]", title="Hydrostatic pressure in the deep ocean")
ax.legend()

plt.show()
Total running time of the script: (0 minutes 0.072 seconds)
